
UNITED STATES SECURITIES AND EXCHANGE COMMISSION
Washington, D.C. 20549
FORM 10-Q
| Quarterly report pursuant to Section 13 or 15(d) of the Securities Exchange Act of 1934 | |||||
For the quarterly period ended March 31, 2026
| Transition report pursuant to Section 13 or 15(d) of the Securities Exchange Act of 1934 | |||||
Commission File Number: 333-203369
(Exact name of registrant as specified in its charter)
| (State or other jurisdiction of incorporation or organization) | (I.R.S. Employer Identification No.) | ||||||||||
| (Address of principal executive offices) | (Zip Code) | ||||||||||
(609 ) 608-1525
(Registrant’s telephone number, including area code)
Securities registered pursuant to Section 12(b) of the Act: None.
Indicate by check mark whether the registrant (1) has filed all reports required to be filed by Section 13 or 15(d) of the Securities Exchange Act of 1934 during the preceding 12 months (or for such shorter period that the registrant was required to file such reports), and (2) has been subject to such filing requirements for the past 90 days.
Indicate by check mark whether the registrant has submitted electronically every Interactive Data File required to be submitted pursuant to Rule 405 of Regulation S-T (§232.405 of this chapter) during the preceding 12 months (or for such shorter period that the registrant was required to submit such files).
Indicate by check mark whether the registrant is a large accelerated filer, an accelerated filer, a non-accelerated filer, a smaller reporting company or an emerging growth company. See the definitions of “large accelerated filer,” “accelerated filer,” “smaller reporting company,” and "emerging growth company" in Rule 12b-2 of the Exchange Act.
| Large accelerated filer | ☐ | Accelerated filer | ☐ | ||||||||
☒ | Smaller reporting company | ||||||||||
Emerging growth company | |||||||||||
If an emerging growth company, indicate by check mark if the registrant has elected not to use the extended transition period for complying with any new or revised financial accounting standards provided pursuant to Section 13(a) of the Exchange Act. o
Indicate by check mark whether the registrant is a shell company (as defined in Rule 12b-2 of the Exchange Act).
Yes ☐ No x
As of May 1, 2026, there were 42,738,750 Class B units outstanding, 121,168,025 Class C units outstanding, and 41,361,142 Class D units outstanding. There is no public market for the registrant's outstanding units.
TABLE OF CONTENTS
Index
2
CAUTIONARY STATEMENT REGARDING FORWARD-LOOKING INFORMATION
This Quarterly Report on Form 10-Q of Clearway Energy LLC, together with its consolidated subsidiaries, or the Company, includes forward-looking statements within the meaning of Section 27A of the Securities Act of 1933, as amended, or the Securities Act, and Section 21E of the Securities Exchange Act of 1934, as amended, or the Exchange Act. The words “believes,” “projects,” “anticipates,” “plans,” “expects,” “intends,” “estimates” and similar expressions are intended to identify forward-looking statements. These forward-looking statements involve known and unknown risks, uncertainties and other factors that may cause the Company’s actual results, performance and achievements, or industry results, to be materially different from any future results, performance or achievements expressed or implied by such forward-looking statements. These factors, risks and uncertainties include the factors described under Item 1A — Risk Factors in Part I of the Company’s Annual Report on Form 10-K for the year ended December 31, 2025, as well as the following:
•The Company’s ability to maintain and grow its quarterly distributions;
•Potential risks related to the Company's relationships with CEG and its owners;
•The Company’s ability to successfully identify, evaluate and consummate investment opportunities, as well as acquisitions from, and dispositions to, third parties;
•The Company’s ability to acquire assets from CEG;
•The Company’s ability to borrow additional funds and access capital markets, as well as the Company’s substantial indebtedness and the possibility that the Company may incur additional indebtedness going forward;
•Changes in law, including judicial decisions;
•Hazards customary to the power production industry and power generation operations such as fuel and electricity price volatility, unusual weather conditions (including wind and solar conditions), catastrophic weather-related or other damage to facilities, unscheduled generation outages, maintenance or repairs, unanticipated changes to fuel supply costs or availability due to higher demand, shortages, transportation problems or other developments, environmental incidents, or electric transmission or gas pipeline system constraints and the possibility that the Company may not have adequate insurance to cover losses as a result of such hazards;
•The Company’s ability to operate its businesses efficiently, manage maintenance capital expenditures and costs effectively, and generate earnings and cash flows from its asset-based businesses in relation to its debt and other obligations;
•The willingness and ability of counterparties to the Company’s offtake agreements to fulfill their obligations under such agreements;
•The Company’s ability to enter into contracts to sell power and procure fuel on acceptable terms and prices;
•Government regulation, including compliance with regulatory requirements and changes in market rules, rates, tariffs and environmental laws;
•Operating and financial restrictions placed on the Company that are contained in the facility-level debt facilities and other agreements of certain subsidiaries and facility-level subsidiaries generally, in the Clearway Energy Operating LLC amended and restated revolving credit facility and in the indentures governing the Senior Notes; and
•Cyber terrorism and inadequate cybersecurity, or the occurrence of a catastrophic loss and the possibility that the Company may not have adequate insurance to cover losses resulting from such hazards or the inability of the Company’s insurers to provide coverage.
Forward-looking statements speak only as of the date they were made, and the Company undertakes no obligation to publicly update or revise any forward-looking statements, whether as a result of new information, future events or otherwise. The foregoing review of factors that could cause the Company’s actual results to differ materially from those contemplated in any forward-looking statements included in this Quarterly Report on Form 10-Q should not be construed as exhaustive.
3
GLOSSARY OF TERMS
When the following terms and abbreviations appear in the text of this report, they have the meanings indicated below:
| 2025 Form 10-K | The Company’s Annual Report on Form 10-K for the year ended December 31, 2025, as filed with the SEC on February 24, 2026 | ||||
| 2028 Senior Notes | $850 million aggregate principal amount of 4.75% unsecured senior notes due 2028, issued by Clearway Energy Operating LLC | ||||
| 2031 Senior Notes | $925 million aggregate principal amount of 3.75% unsecured senior notes due 2031, issued by Clearway Energy Operating LLC | ||||
| 2032 Senior Notes | $350 million aggregate principal amount of 3.75% unsecured senior notes due 2032, issued by Clearway Energy Operating LLC | ||||
| 2034 Senior Notes | $600 million aggregate principal amount of 5.75% unsecured senior notes due 2034, issued by Clearway Energy Operating LLC | ||||
| Adjusted EBITDA | A non-GAAP measure, represents earnings before interest (including loss on debt extinguishment), tax, depreciation and amortization adjusted for mark-to-market gains or losses, asset write offs and impairments; and factors which the Company does not consider indicative of future operating performance | ||||
| ASC | The FASB Accounting Standards Codification, which the FASB established as the source of authoritative GAAP | ||||
| ATM Program | At-The-Market Equity Offering Program | ||||
| BESS | Battery energy storage system | ||||
| CAFD | A non-GAAP measure, Cash Available for Distribution is defined as of March 31, 2026 as Adjusted EBITDA plus cash distributions/return of investment from unconsolidated affiliates, cash receipts from notes receivable, cash distributions from noncontrolling interests, adjustments to reflect sales-type lease cash payments and payments for lease expenses, less cash distributions to noncontrolling interests, maintenance capital expenditures, pro-rata Adjusted EBITDA from unconsolidated affiliates, cash interest paid, income taxes paid, principal amortization of indebtedness, changes in prepaid and accrued capacity payments and adjusted for development expenses | ||||
| Cardinal Portfolio | 610 MW portfolio of operational solar facilities located in eight states that the Company acquired on March 30, 2026, previously referred to as the Deriva Solar Portfolio. | ||||
| Catalina | 109 MW solar facility located in Kern County, California that the Company leases and operates | ||||
| CEG | Clearway Energy Group LLC (formerly Zephyr Renewables LLC) | ||||
| CEG Master Services Agreement | Amended and Restated Master Services Agreement and Payroll Sharing Agreement, effective as of January 1, 2025, among the Company, Clearway, Inc., Clearway Energy Finance Inc., Clearway Energy Operating LLC and CEG | ||||
| Class A Conversion | The conversion of each share of Clearway, Inc.’s Class A common stock into one share of Clearway, Inc.’s Class C common stock, which such conversion occurred on May 1, 2026. | ||||
| Clearway, Inc. | Clearway Energy, Inc., the holder of the Company’s Class C units | ||||
| Clearway Energy Group LLC | The holder of all shares of Clearway, Inc.’s Class B and Class D common stock and the Company’s Class B and Class D units and, from time to time, possibly shares of Clearway, Inc.’s Class C common stock. Clearway Energy Group LLC is a leading developer of renewable energy, energy storage and power infrastructure in the U.S. | ||||
| Clearway Energy Operating LLC | The holder of facilities that are owned by the Company | ||||
| Clearway Renew | Clearway Renew LLC, a subsidiary of CEG, and its wholly-owned subsidiaries | ||||
| Company | Clearway Energy LLC, together with its consolidated subsidiaries | ||||
| CVSR | California Valley Solar Ranch | ||||
| Distributed Solar | Solar power facilities, typically less than 20 MW in size (on an alternating current, or AC, basis), that primarily sell power produced to customers for usage on site, or are interconnected to sell power into the local distribution grid | ||||
| Drop Down Assets | Assets under common control acquired by the Company from CEG | ||||
| DSPP | Direct Stock Purchase Plan | ||||
| ERCOT | Electric Reliability Council of Texas, the ISO and the regional reliability coordinator of the various electricity systems within Texas | ||||
| Exchange Act | The Securities Exchange Act of 1934, as amended | ||||
4
| FASB | Financial Accounting Standards Board | ||||
| GAAP | Accounting principles generally accepted in the U.S. | ||||
| GenConn | GenConn Energy LLC | ||||
| GW | Gigawatt | ||||
| HLBV | Hypothetical Liquidation at Book Value | ||||
| Honeycomb Portfolio | Four BESS facilities under construction in Beaver County and Iron County, Utah representing 320 MW of capacity, which includes Enterprise, Escalante I, Granite Mountain East and Iron Springs that are co-located with the respective solar facilities | ||||
| Honeycomb TargetCo | Honeycomb TargetCo LLC, the indirect owner of the Honeycomb Portfolio | ||||
| ISO | Independent System Operator, also referred to as an RTO | ||||
| ITC | Investment Tax Credit | ||||
| MMBtu | Million British Thermal Units | ||||
| MW | Megawatt | ||||
| MWh | Saleable megawatt hours, net of internal/parasitic load megawatt-hours | ||||
| Net Exposure | Counterparty credit exposure to Clearway Energy LLC, net of collateral | ||||
| OCI/OCL | Other comprehensive income/loss | ||||
| O&M | Operations and Maintenance | ||||
| Palisade Plains Partnership | Palisade Plains Development Partnership LLC, the indirect owner of Goat Mountain | ||||
| PG&E | Pacific Gas and Electric Company | ||||
| PPA | Power Purchase Agreement | ||||
| RENOM | Clearway Renewable Operation & Maintenance LLC, a wholly-owned subsidiary of CEG | ||||
| RTO | Regional Transmission Organization | ||||
| SCE | Southern California Edison | ||||
| SDG&E | San Diego Gas & Electric | ||||
| SEC | U.S. Securities and Exchange Commission | ||||
| Senior Notes | Collectively, the 2028 Senior Notes, the 2031 Senior Notes, the 2032 Senior Notes and the 2034 Senior Notes | ||||
| SOFR | Secured Overnight Financing Rate | ||||
| SPP | Solar Power Partners | ||||
| SREC | Solar Renewable Energy Credit | ||||
| U.S. | United States of America | ||||
| Utility Scale Solar | Solar power facilities, typically 20 MW or greater in size (on an alternating current, or AC, basis), that are interconnected into the transmission or distribution grid to sell power at a wholesale level | ||||
| VIE | Variable Interest Entity | ||||
5
PART I — FINANCIAL INFORMATION
ITEM 1 — FINANCIAL STATEMENTS
CLEARWAY ENERGY LLC
CONSOLIDATED STATEMENTS OF OPERATIONS
(Unaudited)
| Three months ended March 31, | ||||||||||||||
| (In millions) | 2026 | 2025 | ||||||||||||
| Operating Revenues | ||||||||||||||
| Total operating revenues | $ | $ | ||||||||||||
| Operating Costs and Expenses | ||||||||||||||
| Cost of operations, exclusive of depreciation, amortization and accretion shown separately below | ||||||||||||||
| Depreciation, amortization and accretion | ||||||||||||||
| General and administrative | ||||||||||||||
| Transaction and integration costs | ||||||||||||||
| Total operating costs and expenses | ||||||||||||||
| Operating Income | ||||||||||||||
| Other Income (Expense) | ||||||||||||||
| Equity in earnings of unconsolidated affiliates | ||||||||||||||
| Other income, net | ||||||||||||||
| Loss on debt extinguishment | ( | |||||||||||||
| Interest expense | ( | ( | ||||||||||||
| Total other expense, net | ( | ( | ||||||||||||
| Net Loss | ( | ( | ||||||||||||
| Less: Net loss attributable to noncontrolling interests and redeemable noncontrolling interests | ( | ( | ||||||||||||
| Net Income (Loss) Attributable to Clearway Energy LLC | $ | $ | ( | |||||||||||
See accompanying notes to consolidated financial statements.
6
CLEARWAY ENERGY LLC
CONSOLIDATED STATEMENTS OF COMPREHENSIVE INCOME (LOSS)
(Unaudited)
| Three months ended March 31, | ||||||||||||||
| (In millions) | 2026 | 2025 | ||||||||||||
| Net Loss | $ | ( | $ | ( | ||||||||||
| Other Comprehensive Income (Loss) | ||||||||||||||
| Unrealized gain (loss) on derivatives and changes in accumulated OCI/OCL | ( | |||||||||||||
| Other comprehensive income (loss) | ( | |||||||||||||
| Comprehensive Loss | ( | ( | ||||||||||||
| Less: Comprehensive loss attributable to noncontrolling interests and redeemable noncontrolling interests | ( | ( | ||||||||||||
| Comprehensive Income (Loss) Attributable to Clearway Energy LLC | $ | $ | ( | |||||||||||
See accompanying notes to consolidated financial statements.
7
CLEARWAY ENERGY LLC
CONSOLIDATED BALANCE SHEETS
(Unaudited)
| (In millions) | March 31, 2026 | December 31, 2025 | |||||||||
| ASSETS | |||||||||||
| Current Assets | |||||||||||
| Cash and cash equivalents | $ | $ | |||||||||
| Restricted cash | |||||||||||
| Accounts receivable — trade | |||||||||||
| Accounts receivable — affiliates | |||||||||||
| Inventory | |||||||||||
| Derivative instruments | |||||||||||
| Prepayments and other current assets | |||||||||||
| Total current assets | |||||||||||
| Property, plant and equipment, net | |||||||||||
| Other Assets | |||||||||||
| Equity investments in affiliates | |||||||||||
| Intangible assets for power purchase agreements, net | |||||||||||
| Other intangible assets, net | |||||||||||
| Derivative instruments | |||||||||||
| Right-of-use assets, net | |||||||||||
| Other non-current assets | |||||||||||
| Total other assets | |||||||||||
| Total Assets | $ | $ | |||||||||
| LIABILITIES AND MEMBERS’ EQUITY | |||||||||||
| Current Liabilities | |||||||||||
| Current portion of long-term debt — external | $ | $ | |||||||||
| Current portion of long-term debt — affiliate | |||||||||||
| Accounts payable — trade | |||||||||||
| Accounts payable — affiliates | |||||||||||
| Derivative instruments | |||||||||||
| Accrued interest expense | |||||||||||
| Accrued expenses and other current liabilities | |||||||||||
| Total current liabilities | |||||||||||
| Other Liabilities | |||||||||||
| Long-term debt — external | |||||||||||
| Deferred income taxes | |||||||||||
| Derivative instruments | |||||||||||
| Long-term lease liabilities | |||||||||||
| Other non-current liabilities | |||||||||||
| Total other liabilities | |||||||||||
| Total Liabilities | |||||||||||
| Redeemable noncontrolling interest in subsidiaries | |||||||||||
| Commitments and Contingencies | |||||||||||
| Members’ Equity | |||||||||||
| Contributed capital | |||||||||||
| Retained earnings | |||||||||||
| Accumulated other comprehensive loss | ( | ||||||||||
| Noncontrolling interest | |||||||||||
| Total Members’ Equity | |||||||||||
| Total Liabilities and Members’ Equity | $ | $ | |||||||||
See accompanying notes to consolidated financial statements.
8
CLEARWAY ENERGY LLC
CONSOLIDATED STATEMENTS OF CASH FLOWS
(Unaudited)
| Three months ended March 31, | |||||||||||
| (In millions) | 2026 | 2025 | |||||||||
| Cash Flows from Operating Activities | |||||||||||
| Net Loss | $ | ( | $ | ( | |||||||
| Adjustments to reconcile net loss to net cash provided by operating activities: | |||||||||||
| Equity in earnings of unconsolidated affiliates | ( | ( | |||||||||
| Distributions from unconsolidated affiliates | |||||||||||
| Depreciation, amortization and accretion | |||||||||||
| Amortization of financing costs and debt discounts | |||||||||||
| Amortization of intangibles | |||||||||||
| Loss on debt extinguishment | |||||||||||
| Reduction in carrying amount of right-of-use assets | |||||||||||
| Changes in derivative instruments and amortization of accumulated OCI/OCL | ( | ||||||||||
| Changes in other working capital | ( | ( | |||||||||
| Net Cash Provided by Operating Activities | |||||||||||
| Cash Flows from Investing Activities | |||||||||||
| Acquisitions, net of cash acquired | ( | ||||||||||
| Acquisition of Drop Down Assets, net of cash acquired | ( | ||||||||||
| Capital expenditures | ( | ( | |||||||||
| Payments for equipment deposits and asset purchases from affiliate | ( | ||||||||||
| Return of investment from unconsolidated affiliates | |||||||||||
| Investments in unconsolidated affiliates | ( | ||||||||||
| Other | |||||||||||
| Net Cash Used in Investing Activities | ( | ( | |||||||||
| Cash Flows from Financing Activities | |||||||||||
| (Distributions to) Contributions from noncontrolling interests, net | ( | ||||||||||
| Contributions from Clearway, Inc. | |||||||||||
| Distributions to CEG, net of contributions | ( | ( | |||||||||
| Proceeds from the issuance of Class C units | |||||||||||
| Payments of distributions | ( | ( | |||||||||
| Buyout of noncontrolling interest | ( | ||||||||||
| Payments for the revolving credit facility | ( | ||||||||||
| Proceeds from the issuance of long-term debt — external | |||||||||||
| Payments for long-term debt — external | ( | ( | |||||||||
| Payments of debt issuance costs | ( | ||||||||||
| Payments for long-term debt — affiliate | ( | ||||||||||
| Net Cash Provided by (Used in) Financing Activities | ( | ||||||||||
| Net Decrease in Cash, Cash Equivalents and Restricted Cash | ( | ( | |||||||||
| Cash, Cash Equivalents and Restricted Cash at Beginning of Period | |||||||||||
| Cash, Cash Equivalents and Restricted Cash at End of Period | $ | $ | |||||||||
See accompanying notes to consolidated financial statements.
9
CLEARWAY ENERGY LLC
CONSOLIDATED STATEMENTS OF MEMBERS’ EQUITY
For the Three Months Ended March 31, 2026 and 2025
(Unaudited)
| (In millions) | Contributed Capital | Retained Earnings | Accumulated Other Comprehensive Loss | Noncontrolling Interest | Total Members’ Equity | ||||||||||||||||||||||||
| Balances at December 31, 2025 | $ | $ | $ | ( | $ | $ | |||||||||||||||||||||||
| Net income (loss) | — | — | ( | ( | |||||||||||||||||||||||||
| Unrealized gain on derivatives and changes in accumulated OCL | — | — | |||||||||||||||||||||||||||
| Distributions to CEG, net of contributions, cash | ( | — | — | — | ( | ||||||||||||||||||||||||
| Distributions to noncontrolling interests, net of contributions, cash | — | — | — | ( | ( | ||||||||||||||||||||||||
| Contributions from Clearway, Inc., cash | — | — | |||||||||||||||||||||||||||
| Transfers of assets under common control | ( | — | — | — | ( | ||||||||||||||||||||||||
| Cardinal Portfolio acquisition | — | — | — | ||||||||||||||||||||||||||
| Buyout of noncontrolling interest | — | — | ( | ( | |||||||||||||||||||||||||
| Proceeds from issuance of Class C units | — | — | — | ||||||||||||||||||||||||||
| Distributions paid to Clearway, Inc. | — | ( | — | — | ( | ||||||||||||||||||||||||
| Distributions paid to CEG Class B and Class D unit holders | — | ( | — | — | ( | ||||||||||||||||||||||||
| Other | — | — | ( | ||||||||||||||||||||||||||
| Balances at March 31, 2026 | $ | $ | $ | $ | $ | ||||||||||||||||||||||||
| (In millions) | Contributed Capital | Retained Earnings | Accumulated Other Comprehensive Income | Noncontrolling Interest | Total Members’ Equity | ||||||||||||||||||||||||
| Balances at December 31, 2024 | $ | $ | $ | $ | $ | ||||||||||||||||||||||||
| Net loss | — | ( | — | ( | ( | ||||||||||||||||||||||||
| Unrealized loss on derivatives and changes in accumulated OCI | — | — | ( | ( | ( | ||||||||||||||||||||||||
| Distributions to CEG, net of contributions, cash | ( | — | — | — | ( | ||||||||||||||||||||||||
| Contributions from noncontrolling interests, net of distributions, cash | — | — | — | ||||||||||||||||||||||||||
| Distributions to noncontrolling interests, net of distributions, non-cash | — | — | — | ( | ( | ||||||||||||||||||||||||
| Transfers of assets under common control | ( | — | ( | ( | |||||||||||||||||||||||||
| Distributions paid to Clearway, Inc. | — | ( | — | — | ( | ||||||||||||||||||||||||
| Distributions paid to CEG Class B and Class D unit holders | — | ( | — | — | ( | ||||||||||||||||||||||||
| Other | — | — | — | ||||||||||||||||||||||||||
| Balances at March 31, 2025 | $ | $ | $ | $ | $ | ||||||||||||||||||||||||
See accompanying notes to consolidated financial statements.
10
CLEARWAY ENERGY LLC
NOTES TO CONSOLIDATED FINANCIAL STATEMENTS
(Unaudited)
Note 1 — Nature of Business
Clearway Energy LLC, together with its consolidated subsidiaries, or the Company, is an energy infrastructure investor with a focus on investments in clean energy and owner of modern, sustainable and long-term contracted assets across North America. The Company is sponsored by Clearway Energy Group LLC, or CEG.
The Company is one of the largest owners of clean energy generation assets in the U.S. The Company’s portfolio comprises approximately 13.6 GW of gross capacity in 27 states, including approximately 10.8 GW of wind, solar and battery energy storage systems, or BESS, and approximately 2.8 GW of dispatchable combustion-based power generation assets included in the Flexible Generation segment that provide critical grid reliability services. Through this environmentally-sound, diversified and primarily contracted portfolio, the Company endeavors to provide its investors with stable and growing distributions. The majority of the Company’s revenues are derived from long-term contractual arrangements for the output or capacity from these assets.
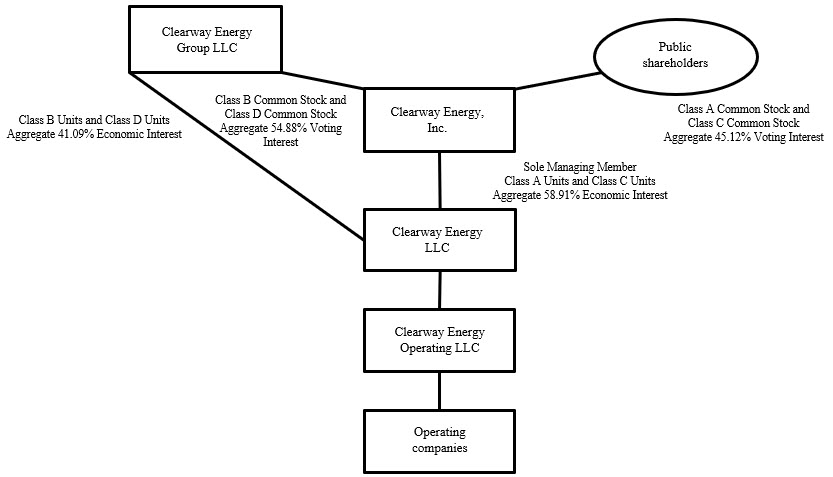
Clearway Energy, Inc., or Clearway, Inc., consolidates the results of the Company through its controlling interest, with CEG’s interest shown as contributed capital in the Company’s consolidated financial statements. The holders of Clearway, Inc.’s outstanding shares of Class C common stock, including shares that were received in the Class A Conversion, are entitled to dividends as declared. CEG receives its distributions from the Company through its ownership of the Company’s Class B and Class D units.
As of March 31, 2026, Clearway, Inc. owned 58.91 % of the economic interests of the Company, with CEG owning 41.09 % of the economic interests of the Company.
The diagram below represents a summarized structure of the Company as of March 31, 2026 (prior to the Class A Conversion):
11
Class A Conversion
On April 29, 2026, at Clearway, Inc.’s Annual Meeting of Stockholders, Clearway, Inc.’s stockholders approved a Second Amended and Restated Certificate of Incorporation, or the Amended Charter, pursuant to which each outstanding share of Clearway, Inc.’s Class A common stock was converted into one share of Clearway, Inc.’s Class C common stock, effective May 1, 2026, referred to as the Class A Conversion. Accordingly, Clearway, Inc. no longer has any Class A common stock outstanding. Effective concurrently with the Class A Conversion, each outstanding Class A unit of the Company was converted into one Class C unit of the Company. See Note 8, Members’ Equity, for further discussion of the Class A Conversion.
Basis of Presentation
The accompanying unaudited interim consolidated financial statements have been prepared in accordance with the SEC’s regulations for interim financial information and with the instructions to Form 10-Q. Accordingly, they do not include all of the information and notes required by GAAP for complete financial statements. Certain prior period financial information included in these unaudited interim consolidated financial statements has been revised to correct immaterial errors. See Note 11, Revision of Previously Issued Unaudited Financial Information, for additional information.
The following notes should be read in conjunction with the accounting policies and other disclosures as set forth in the notes to the consolidated financial statements included in the Company’s 2025 Form 10-K. Interim results are not necessarily indicative of results for a full year.
In the opinion of management, the accompanying unaudited interim consolidated financial statements contain all material adjustments consisting of normal and recurring accruals necessary for a fair statement of the Company’s consolidated financial position as of March 31, 2026 and December 31, 2025, and results of operations, comprehensive income (loss) and cash flows for the three months ended March 31, 2026 and 2025.
Note 2 — Summary of Significant Accounting Policies
Use of Estimates
The preparation of consolidated financial statements in accordance with GAAP requires management to make estimates and assumptions. These estimates and assumptions impact the reported amounts of assets and liabilities and disclosures of contingent assets and liabilities as of the date of the consolidated financial statements. They also impact the reported amounts of net earnings during the reporting periods. Actual results could be different from these estimates.
Cash, Cash Equivalents and Restricted Cash
The following table provides a reconciliation of cash, cash equivalents and restricted cash reported within the consolidated balance sheets that sum to the total of the same such amounts shown in the consolidated statements of cash flows:
| March 31, 2026 | December 31, 2025 | ||||||||||
| (In millions) | |||||||||||
| Cash and cash equivalents | $ | $ | |||||||||
| Restricted cash | |||||||||||
| Cash, cash equivalents and restricted cash shown in the consolidated statements of cash flows | $ | $ | |||||||||
12
Accumulated Depreciation and Accumulated Amortization
The following table presents the accumulated depreciation included in property, plant and equipment, net, and accumulated amortization included in intangible assets, net:
| March 31, 2026 | December 31, 2025 | ||||||||||
| (In millions) | |||||||||||
| Property, Plant and Equipment Accumulated Depreciation | $ | $ | |||||||||
| Intangible Assets Accumulated Amortization | |||||||||||
Redeemable Noncontrolling Interests
To the extent that a third party has the right to redeem their interests for cash or other assets, the Company has included the noncontrolling interest attributable to the third party as a component of temporary equity in the mezzanine section of the consolidated balance sheet. The following table reflects the changes in the Company’s redeemable noncontrolling interest balance:
| (In millions) | ||||||||
| Balance at December 31, 2025 | $ | |||||||
| Cash distributions to redeemable noncontrolling interests | ( | |||||||
| Non-cash contribution from redeemable noncontrolling interests | ||||||||
| Comprehensive loss attributable to redeemable noncontrolling interests | ( | |||||||
| Balance at March 31, 2026 | $ | |||||||
Revenue Recognition
Disaggregated Revenues
The following tables represent the Company’s disaggregation of revenue from contracts with customers along with the reportable segment for each category:
| Three months ended March 31, 2026 | |||||||||||||||||
| (In millions) | Flexible Generation | Renewables & Storage | Total | ||||||||||||||
Energy revenue(a) | $ | $ | $ | ||||||||||||||
Capacity revenue(a) | |||||||||||||||||
| Other revenues | |||||||||||||||||
| Contract amortization | ( | ( | ( | ||||||||||||||
| Mark-to-market for economic hedges | ( | ||||||||||||||||
| Total operating revenues | |||||||||||||||||
| Less: Contract amortization | |||||||||||||||||
| Less: Mark-to-market for economic hedges | ( | ( | |||||||||||||||
| ( | ( | ( | |||||||||||||||
Total revenue from contracts with customers | $ | $ | $ | ||||||||||||||
(a) The following amounts of energy and capacity revenues relate to leases and are accounted for under ASC 842:
| (In millions) | Flexible Generation | Renewables & Storage | Total | ||||||||||||||
| Energy revenue | $ | $ | $ | ||||||||||||||
| Capacity revenue | |||||||||||||||||
Total | $ | $ | $ | ||||||||||||||
13
| Three months ended March 31, 2025 | |||||||||||||||||
| (In millions) | Flexible Generation | Renewables & Storage | Total | ||||||||||||||
Energy revenue (a) | $ | $ | $ | ||||||||||||||
Capacity revenue (a) | |||||||||||||||||
| Other revenues | |||||||||||||||||
| Contract amortization | ( | ( | ( | ||||||||||||||
| Mark-to-market for economic hedges | ( | ( | |||||||||||||||
| Total operating revenues | |||||||||||||||||
| Less: Contract amortization | |||||||||||||||||
| Less: Mark-to-market for economic hedges | ( | ||||||||||||||||
| ( | ( | ( | |||||||||||||||
Total revenue from contracts with customers | $ | $ | $ | ||||||||||||||
(a) The following amounts of energy and capacity revenues relate to leases and are accounted for under ASC 842:
| (In millions) | Flexible Generation | Renewables & Storage | Total | ||||||||||||||
| Energy revenue | $ | $ | $ | ||||||||||||||
| Capacity revenue | |||||||||||||||||
Total | $ | $ | $ | ||||||||||||||
Contract Balances
The following table reflects the contract assets included on the Company’s consolidated balance sheets:
| March 31, 2026 | December 31, 2025 | ||||||||||
| (In millions) | |||||||||||
| Accounts receivable, net - Contracts with customers | $ | $ | |||||||||
| Accounts receivable, net - Leases | |||||||||||
| Total accounts receivable, net | $ | $ | |||||||||
Recently Adopted Accounting Standards
Effective January 1, 2026, the Company adopted ASU No. 2025-06, Intangibles - Goodwill and Other - Internal-Use Software (Subtopic 350-40): Targeted Improvements to the Accounting for Internal-Use Software. The amendment clarifies when software costs should be capitalized and requires certain disclosures for all capitalized internal-use software costs. The Company adopted ASU 2025-06 prospectively and the adoption had no material impact on the Company’s financial statements.
Effective January 1, 2026, the Company adopted ASU No. 2025-07, Derivatives and Hedging (Topic 815) and Revenue from Contracts with Customers (Topic 606): Derivatives Scope Refinements and Scope Clarification for Share-Based Noncash Consideration from a Customer in a Revenue Contract. The amendment expands the derivative scope exceptions and clarifies when an entity should apply the guidance in ASC 606, Revenue from Contracts with Customers, to contracts with share-based noncash consideration from a customer for the transfer of goods or services. The Company adopted ASU 2025-07 prospectively, and the adoption had no material impact on the Company’s financial statements.
14
Note 3 — Acquisitions
Cardinal Portfolio Acquisition — On March 30, 2026, the Company, through its indirect subsidiaries, Cardinal Purchaser LLC and Cardinal JV Purchaser LLC, completed the acquisition of the Cardinal Portfolio, a 610 MW portfolio of operational solar facilities located in eight states, for total cash consideration of $324 million, subject to post-closing adjustments. Of the total consideration, $244 million related to facilities consolidated by the Company and $80 million related to facilities held through a joint venture with a third-party investor. The joint venture includes 12 facilities located in the western U.S., comprising 225 MW. The Company’s investment in the joint venture is accounted for under the equity method, as further described in Note 4, Investments Accounted for by the Equity Method and Variable Interest Entities. The Cardinal Portfolio has a weighted average remaining contract duration of approximately 10 years. The Cardinal Portfolio is reflected in the Renewables & Storage segment and the acquisition was funded with $100 million in borrowings under the new financing arrangement entered into in connection with the acquisition, as further described in Note 7, Long-term Debt, as well as existing sources of liquidity. After factoring in cash acquired, transaction expenses and proceeds from the related financing activities, the Company estimates that its net capital investment in the Cardinal Portfolio will be approximately $240 million.
The Company accounted for the consolidated group of facilities acquired by Cardinal Purchaser LLC as a business combination under ASC 805, Business Combinations, or ASC 805. The following table presents the preliminary fair value estimates of the assets acquired and liabilities assumed by Cardinal Purchaser LLC as of the acquisition date:
| (In millions) | Cardinal Portfolio (a) | |||||||
| Cash | $ | |||||||
| Restricted cash | ||||||||
| Property, plant and equipment | ||||||||
| Intangible assets for power purchase agreements | ||||||||
| Right-of-use assets | ||||||||
| Derivative assets | ||||||||
| Other current and non-current assets | ||||||||
| Total assets acquired | ||||||||
Long-term debt (b) | ||||||||
| Long-term lease liabilities | ||||||||
| Other current liabilities | ||||||||
| Other non-current liabilities | ||||||||
| Total liabilities assumed | ||||||||
Noncontrolling interest (c) | ||||||||
| Net assets acquired | $ | |||||||
(a) Excludes the equity method investment held by Cardinal JV Purchaser LLC.
(b) See Note 7, Long-term Debt, for additional information regarding the assumed facility-level debt.
(c) Represents a tax equity fund, Shoreham Energy Holdings, LLC, which the Company consolidates as primary beneficiary. The Class A membership interests in Shoreham Energy Holdings, LLC are held by a tax equity investor.
In accordance with ASC 805, the assets acquired and liabilities assumed have been measured at fair value as of the acquisition date. The fair value of property, plant and equipment was determined primarily based on the income approach using discounted cash flows. This methodology was utilized as the forecasted cash flows incorporate specific attributes including age, useful life, equipment condition and technology. The fair value of intangible assets and liabilities for power purchase agreements was determined utilizing a variation of the income approach determined by discounting the replacement market price of the incremental cash flows associated with the contracts to present value. Intangible liabilities for power purchase agreements are included in other non-current liabilities. Primary assumptions utilized included estimates of generation, contractual prices, operating expenses and the weighted average cost of capital reflective of a market participant. These assumptions are considered to be a Level 3 measurement as defined in ASC 820, Fair Value Measurement, as they utilize inputs that are not observable in the market. Long-term debt assumed as part of the acquisition was recorded at its estimated fair value as of the acquisition date.
15
The Company is in the process of completing the fair value measurement of the acquired assets, assumed liabilities and noncontrolling interests, and accordingly the amounts above are preliminary. The Company expects to finalize the fair value estimates within the measurement period, which will not exceed one year from the acquisition date.
The revenue and earnings of the acquired business from the acquisition date through March 31, 2026 were not material and have not been separately disclosed. In addition, supplemental unaudited pro forma revenue and earnings information assuming the acquisition occurred at the beginning of the prior calendar year has not been disclosed, as such information would not be meaningful given the timing of the acquisition.
Note 4 — Investments Accounted for by the Equity Method and Variable Interest Entities
Entities that are not Consolidated
The Company has interests in entities that are considered VIEs under ASC 810, but for which it is not considered the primary beneficiary. The Company accounts for its interests in these entities and entities in which it has a significant investment under the equity method of accounting, as further described under Item 15 — Note 5, Investments Accounted for by the Equity Method and Variable Interest Entities, to the consolidated financial statements included in the Company’s 2025 Form 10-K.
The following table reflects the Company’s equity investments in unconsolidated affiliates as of March 31, 2026:
| Name | Economic Interest | Investment Balance (a) | ||||||||||||
| (In millions) | ||||||||||||||
| Avenal | $ | |||||||||||||
Cardinal Portfolio JV (b) | ||||||||||||||
| Desert Sunlight | ||||||||||||||
| Elkhorn Ridge | ( | |||||||||||||
GenConn (c) | ||||||||||||||
| San Juan Mesa | ( | |||||||||||||
| $ | ||||||||||||||
(a) The Company’s maximum exposure to loss is limited to its investment balances.
(b) Acquired on March 30, 2026. See Note 3, Acquisitions, for further discussion.
(c) GenConn is a VIE.
The Company’s pro-rata share of non-recourse debt held by unconsolidated affiliates was $367 million as of March 31, 2026.
Entities that are Consolidated
As further described under Item 15 — Note 5, Investments Accounted for by the Equity Method and Variable Interest Entities, to the consolidated financial statements included in the Company’s 2025 Form 10-K, the Company has a controlling financial interest in certain entities which have been identified as VIEs under ASC 810, Consolidation, or ASC 810. These arrangements are primarily related to tax equity arrangements entered into with third parties in order to monetize certain tax credits associated with wind, solar and BESS facilities. The Company also has a controlling financial interest in certain partnership arrangements with third-party investors, which also have been identified as VIEs. Under the Company’s arrangements that have been identified as VIEs, the third-party investors are allocated earnings, tax attributes and distributable cash in accordance with the respective limited liability company agreements. Many of these arrangements also provide a mechanism to facilitate achievement of the investor’s specified return by providing incremental cash distributions to the investor at a specified date if the specified return has not yet been achieved.
16
The following is a summary of significant activity during the three months ended March 31, 2026 related to the Company’s consolidated VIEs:
Palisade Plains Partnership — On February 19, 2026, Clearway Renew contributed its rights and interests in certain transformer supply agreements to Palisade Plains Development Partnership LLC, or Palisade Plains Partnership, an indirect subsidiary of the Company, in exchange for Class A membership interests. In connection with the transaction, Clearway Renew contributed $6 million for deposits related to the future delivery of equipment, which is included in other non-current assets on the Company’s consolidated balance sheet, and received a distribution of $5 million. The Class A membership interests held by Clearway Renew are reflected as redeemable noncontrolling interest on the Company’s consolidated balance sheet, as the arrangement provides Clearway Renew with the right to redeem their interests in the partnership for cash or other assets at a point in time. Palisade Plains Partnership is a VIE that indirectly owns the Goat Mountain wind facility and whose purpose is to carry out the development, construction and completion of the repowering of the facility. Palisade Plains Development Partnership Holdco LLC, an indirect subsidiary of the Company, consolidates Palisade Plains Partnership as primary beneficiary through its Class B membership interests, which entitles the Company to 99 % of distributable cash.
Summarized financial information for the Company’s consolidated VIEs consisted of the following:
| (In millions) | March 31, 2026 | December 31, 2025 | |||||||||
| Other current assets | $ | $ | |||||||||
| Other non-current assets | |||||||||||
| Property, plant and equipment | |||||||||||
| Total assets | $ | $ | |||||||||
| Other current liabilities | $ | $ | |||||||||
| Other non-current liabilities | |||||||||||
| Total liabilities | $ | $ | |||||||||
Note 5 — Fair Value of Financial Instruments
Fair Value Accounting under ASC 820
ASC 820 establishes a fair value hierarchy that prioritizes the inputs to valuation techniques used to measure fair value into three levels as follows:
•Level 1—quoted prices (unadjusted) in active markets for identical assets or liabilities that the Company has the ability to access as of the measurement date.
•Level 2—inputs other than quoted prices included within Level 1 that are directly observable for the asset or liability or indirectly observable through corroboration with observable market data.
•Level 3—unobservable inputs for the asset or liability only used when there is little, if any, market activity for the asset or liability at the measurement date.
In accordance with ASC 820, the Company determines the level in the fair value hierarchy within which each fair value measurement in its entirety falls, based on the lowest level input that is significant to the fair value measurement.
For cash and cash equivalents, restricted cash, accounts receivable — trade, accounts receivable — affiliates, accounts payable — trade, accounts payable — affiliates and accrued expenses and other current liabilities, the carrying amounts approximate fair value because of the short-term maturity of those instruments and are classified as Level 1 within the fair value hierarchy.
The carrying amounts and estimated fair values of the Company’s recorded financial instruments not carried at fair market value or that does not approximate fair value are as follows:
| As of March 31, 2026 | As of December 31, 2025 | ||||||||||||||||||||||
| Carrying Amount | Fair Value | Carrying Amount | Fair Value | ||||||||||||||||||||
| (In millions) | |||||||||||||||||||||||
| Long-term debt, including current portion — affiliate | $ | $ | $ | $ | |||||||||||||||||||
Long-term debt, including current portion — external (a) | |||||||||||||||||||||||
(a) Excludes net debt issuance costs, which are recorded as a reduction to long-term debt on the Company’s consolidated balance sheets.
17
The fair value of the Company’s publicly-traded long-term debt is based on quoted market prices and is classified as Level 2 within the fair value hierarchy. The fair value of debt securities, non-publicly traded long-term debt and certain notes receivable of the Company are based on expected future cash flows discounted at market interest rates, or current interest rates for similar instruments with equivalent credit quality and are classified as Level 3 within the fair value hierarchy. The following table presents the level within the fair value hierarchy for long-term debt, including current portion:
| As of March 31, 2026 | As of December 31, 2025 | ||||||||||||||||||||||
| Level 2 | Level 3 | Level 2 | Level 3 | ||||||||||||||||||||
| (In millions) | |||||||||||||||||||||||
| Long-term debt, including current portion | $ | $ | $ | $ | |||||||||||||||||||
Recurring Fair Value Measurements
The Company records its derivative assets and liabilities at fair market value on its consolidated balance sheets. The following table presents assets and liabilities measured and recorded at fair value on the Company’s consolidated balance sheets on a recurring basis and their level within the fair value hierarchy:
| As of March 31, 2026 | As of December 31, 2025 | ||||||||||||||||||||||
Fair Value (a) | Fair Value (a) | ||||||||||||||||||||||
| (In millions) | Level 2 (b) | Level 3 | Level 2 (b) | Level 3 | |||||||||||||||||||
| Derivative assets: | |||||||||||||||||||||||
Energy-related commodity contracts (c) | $ | $ | $ | $ | |||||||||||||||||||
| Interest rate contracts | |||||||||||||||||||||||
Other financial instruments (d) | |||||||||||||||||||||||
| Total assets | $ | $ | $ | $ | |||||||||||||||||||
| Derivative liabilities: | |||||||||||||||||||||||
Energy-related commodity contracts (e) | $ | $ | $ | $ | |||||||||||||||||||
| Interest rate contracts | |||||||||||||||||||||||
| Total liabilities | $ | $ | $ | $ | |||||||||||||||||||
(a) There were no derivative assets or liabilities classified as Level 1 as of March 31, 2026 and December 31, 2025.
(b) The Company’s interest rate swaps are measured at fair value using an income approach, which uses readily observable inputs, such as forward interest rates (e.g., SOFR) and contractual terms to estimate fair value.
(c) Includes short-term backbone transportation service contracts classified as Level 2 and heat rate call option contracts classified as Level 3.
(d) Includes SREC contract.
(e) Includes long-term power commodity contracts and heat rate call option contracts classified as Level 3. As of March 31, 2026 and December 31, 2025, $178 million and $330 million, respectively, related to long-term power commodity contracts, and $4 million and $3 million, respectively, related to heat rate call option contracts.
The following table reconciles the beginning and ending balances for instruments that are recognized at fair value in the consolidated financial statements using significant unobservable inputs:
| Three months ended March 31, | ||||||||||||||
| 2026 | 2025 | |||||||||||||
| (In millions) | Fair Value Measurement Using Significant Unobservable Inputs (Level 3) | |||||||||||||
| Beginning balance | $ | ( | $ | ( | ||||||||||
| Settlements | ||||||||||||||
Transfers out of Level 3 (a) | ||||||||||||||
| ( | ||||||||||||||
| Ending balance | $ | ( | $ | ( | ||||||||||
| Change in unrealized gains included in earnings for derivatives and other financial instruments held as of March 31, 2026 | $ | |||||||||||||
(a) On March 27, 2026, the Company restructured the Mesquite Sky energy-related commodity contract, resulting in the derecognition of the related derivative liabilities and its classification as an in-substance financing. See Note 7, Long-term Debt, for further discussion.
18
Derivative and Financial Instruments Fair Value Measurements
The Company's contracts are non-exchange-traded and valued using prices provided by external sources. The Company uses quoted observable forward prices to value its energy-related commodity contracts, which includes long-term power commodity contracts and heat rate call option contracts. To the extent that observable forward prices are not available, the quoted prices reflect the average of the forward prices from the prior year, adjusted for inflation. As of March 31, 2026, contracts valued with prices provided by models and other valuation techniques make up 4 % of derivative assets, 90 % of derivative liabilities and 100 % of other financial instruments.
The Company’s significant positions classified as Level 3 relate to physical and financial energy-related contracts, including long-term power commodity contracts and heat rate call option contracts executed in illiquid markets. The significant unobservable inputs used in developing fair value include illiquid power tenors and location pricing, which is derived by extrapolating pricing as a basis to liquid locations. The tenor pricing and basis spread are based on observable market data when available or derived from historic prices and forward market prices from similar observable markets when not available.
The following table quantifies the significant unobservable inputs used in developing the fair value of the Company’s Level 3 positions:
| March 31, 2026 | |||||||||||||||||||||||
| Fair Value | Input/Range | ||||||||||||||||||||||
| Assets | Liabilities | Valuation Technique | Significant Unobservable Input | Low | High | Weighted Average | |||||||||||||||||
| (In millions) | |||||||||||||||||||||||
| Long-term Power Commodity Contracts | $ | $ | Discounted Cash Flow | Forward Market Price ($ per MWh) | $ | $ | $ | ||||||||||||||||
| Heat Rate Call Option Commodity Contracts | Option Model | Forward Market Price ($ per MWh) | ( | ||||||||||||||||||||
| Option Model | Forward Market Price ($ per MMBtu) | ||||||||||||||||||||||
| Other Financial Instruments | Discounted Cash Flow | Forecast annual generation levels of certain DG solar facilities | |||||||||||||||||||||
The following table provides the impact on the fair value measurements to increases/(decreases) in significant unobservable inputs as of March 31, 2026:
| Type | Significant Unobservable Input | Position | Change In Input | Impact on Fair Value Measurement | ||||||||||
| Energy-Related Commodity Contracts | Forward Market Price Power | Sell | Increase/(Decrease) | Lower/(Higher) | ||||||||||
| Energy-Related Commodity Contracts | Forward Market Price Gas | Sell | Increase/(Decrease) | Higher/(Lower) | ||||||||||
| Other Financial Instruments | Forecast Generation Levels | Sell | Increase/(Decrease) | Higher/(Lower) | ||||||||||
The fair value of each contract is discounted using a risk-free interest rate. In addition, a credit reserve is applied to reflect credit risk, which is, for interest rate swaps, calculated based on credit default swaps using the bilateral method. For commodities, to the extent that the Net Exposure under a specific master agreement is an asset, the Company uses the counterparty’s default swap rate. If the Net Exposure under a specific master agreement is a liability, the Company uses a proxy of its own default swap rate. For interest rate swaps and commodities, the credit reserve is added to the discounted fair value to reflect the exit price that a market participant would be willing to receive to assume the liabilities or that a market participant would be willing to pay for the assets. As of March 31, 2026, the non-performance reserve was a $7 million gain recorded primarily to total operating revenues in the consolidated statements of operations. It is possible that future market prices could vary from those used in recording assets and liabilities and such variations could be material.
19
Concentration of Credit Risk
In addition to the credit risk discussion as disclosed under Item 15 — Note 2, Summary of Significant Accounting Policies, to the consolidated financial statements included in the Company’s 2025 Form 10-K, the following item is a discussion of the concentration of credit risk for the Company’s financial instruments. Credit risk relates to the risk of loss resulting from non-performance or non-payment by counterparties pursuant to the terms of their contractual obligations. The Company monitors and manages credit risk through credit policies that include: (i) an established credit approval process; (ii) monitoring of counterparties’ credit limits on an as needed basis; (iii) as applicable, the use of credit mitigation measures such as margin, collateral, prepayment arrangements, or volumetric limits; (iv) the use of payment netting agreements; and (v) the use of master netting agreements that allow for the netting of positive and negative exposures of various contracts associated with a single counterparty. Risks surrounding counterparty performance and credit could ultimately impact the amount and timing of expected cash flows. The Company seeks to mitigate counterparty risk by having a diversified portfolio of counterparties.
Counterparty credit exposure includes credit risk exposure under certain long-term agreements, including solar and other PPAs. As external sources or observable market quotes are not available to estimate such exposure, the Company estimates the exposure related to these contracts based on various techniques including, but not limited to, internal models based on a fundamental analysis of the market and extrapolation of observable market data with similar characteristics. A significant portion of these energy-related commodity contracts are with utilities with strong credit quality and public utility commission or other regulatory support. However, such regulated utility counterparties can be impacted by changes in government regulations or adverse financial conditions, which the Company is unable to predict. Certain subsidiaries of the Company sell the output of their facilities to PG&E, a significant counterparty of the Company, under long-term PPAs, and PG&E’s credit rating is below investment-grade.
Note 6 — Derivative Instruments and Hedging Activities
Interest Rate Swaps
The Company enters into interest rate swap agreements in order to hedge the variability of expected future cash interest payments that may arise in connection with its non-recourse debt or a potential refinancing of its Senior Notes. As of March 31, 2026, the Company had interest rate derivative instruments extending through 2036, a portion of which were designated as cash flow hedges. Under the interest rate swap agreements, the Company pays a fixed rate and the counterparties to the agreements pay a variable interest rate.
Energy-Related Commodity Contracts
As of March 31, 2026, the Company had energy-related derivative instruments extending through 2033. At March 31, 2026, these contracts were not designated as cash flow or fair value hedges.
Volumetric Underlying Derivative Transactions
The following table summarizes the net notional volume buy/(sell) of the Company’s open derivative transactions broken out by commodity:
| Total Volume | |||||||||||||||||
| March 31, 2026 | December 31, 2025 | ||||||||||||||||
| Commodity | Units | (In millions) | |||||||||||||||
| Power | MWh | ( | ( | ||||||||||||||
| Natural Gas | MMBtu | ||||||||||||||||
| Interest | Dollars | $ | $ | ||||||||||||||
20
Fair Value of Derivative Instruments
The following table summarizes the fair value within the derivative instrument valuation on the consolidated balance sheets:
| Fair Value | |||||||||||||||||||||||
| Derivative Assets | Derivative Liabilities | ||||||||||||||||||||||
| March 31, 2026 | December 31, 2025 | March 31, 2026 | December 31, 2025 | ||||||||||||||||||||
| (In millions) | |||||||||||||||||||||||
| Derivatives Designated as Cash Flow Hedges: | |||||||||||||||||||||||
| Interest rate contracts current | $ | $ | $ | $ | |||||||||||||||||||
| Interest rate contracts long-term | |||||||||||||||||||||||
| Total Derivatives Designated as Cash Flow Hedges | $ | $ | $ | $ | |||||||||||||||||||
| Derivatives Not Designated as Cash Flow Hedges: | |||||||||||||||||||||||
| Interest rate contracts current | $ | $ | $ | $ | |||||||||||||||||||
| Interest rate contracts long-term | |||||||||||||||||||||||
| Energy-related commodity contracts current | |||||||||||||||||||||||
| Energy-related commodity contracts long-term | |||||||||||||||||||||||
| Total Derivatives Not Designated as Cash Flow Hedges | $ | $ | $ | $ | |||||||||||||||||||
| Total Derivatives | $ | $ | $ | $ | |||||||||||||||||||
The Company has elected to present derivative assets and liabilities on the balance sheet on a trade-by-trade basis and does not offset amounts at the counterparty level. As of March 31, 2026 and December 31, 2025, the amount of outstanding collateral paid or received was immaterial. The following tables summarize the offsetting of derivatives by counterparty:
| Gross Amounts Not Offset in the Statement of Financial Position | |||||||||||||||||
| As of March 31, 2026 | Gross Amounts of Recognized Assets/Liabilities | Derivative Instruments | Net Amount | ||||||||||||||
| Energy-related commodity contracts | (In millions) | ||||||||||||||||
| Derivative assets | $ | $ | $ | ||||||||||||||
| Derivative liabilities | ( | ( | |||||||||||||||
| Total energy-related commodity contracts | $ | ( | $ | $ | ( | ||||||||||||
| Interest rate contracts | |||||||||||||||||
| Derivative assets | $ | $ | $ | ||||||||||||||
| Derivative liabilities | ( | ( | |||||||||||||||
| Total interest rate contracts | $ | $ | $ | ||||||||||||||
| Total derivative instruments | $ | ( | $ | $ | ( | ||||||||||||
| Gross Amounts Not Offset in the Statement of Financial Position | |||||||||||||||||
| As of December 31, 2025 | Gross Amounts of Recognized Assets/Liabilities | Derivative Instruments | Net Amount | ||||||||||||||
| Energy-related commodity contracts | (In millions) | ||||||||||||||||
| Derivative assets | $ | $ | $ | ||||||||||||||
| Derivative liabilities | ( | ( | |||||||||||||||
| Total energy-related commodity contracts | $ | ( | $ | $ | ( | ||||||||||||
| Interest rate contracts | |||||||||||||||||
| Derivative assets | $ | $ | $ | ||||||||||||||
| Derivative liabilities | ( | ( | |||||||||||||||
| Total interest rate contracts | $ | $ | $ | ||||||||||||||
| Total derivative instruments | $ | ( | $ | $ | ( | ||||||||||||
21
Accumulated Other Comprehensive Income (Loss)
The following table summarizes the effects on the Company’s accumulated OCI (OCL) balance attributable to interest rate swaps designated as cash flow hedge derivatives:
| Three months ended March 31, | ||||||||||||||
| 2026 | 2025 | |||||||||||||
| (In millions) | ||||||||||||||
| Accumulated (OCL) OCI beginning balance | $ | ( | $ | |||||||||||
Rosamond South I Drop Down (a) | ( | |||||||||||||
| Reclassified from accumulated OCI/OCL to income due to realization of previously deferred amounts | ||||||||||||||
| Mark-to-market of cash flow hedge accounting contracts | ( | |||||||||||||
| Accumulated OCI ending balance | ||||||||||||||
| Accumulated OCI attributable to noncontrolling interests | ||||||||||||||
| Accumulated OCI attributable to Clearway Energy LLC | $ | $ | ||||||||||||
| Losses expected to be realized from OCI during the next 12 months | $ | |||||||||||||
(a) Represents $2 million attributable to the Company and $2 million attributable to noncontrolling interests.
Amounts reclassified from accumulated OCI/OCL into income are recorded to interest expense.
Impact of Derivative Instruments on the Consolidated Statements of Operations
Mark-to-market gains/(losses) related to the Company’s derivatives are recorded in the consolidated statements of operations as follows:
| Three months ended March 31, | ||||||||||||||
| 2026 | 2025 | |||||||||||||
| (In millions) | ||||||||||||||
| Interest Rate Contracts (Interest expense) | $ | $ | ( | |||||||||||
Energy-Related Commodity Contracts (Mark-to-market for economic hedging activities included in Total operating revenues) (a) | ( | |||||||||||||
(a) Relates to long-term energy related commodity contracts at Elbow Creek, Mesquite Star, Mt. Storm, Langford and Mesquite Sky and heat rate call option energy-related commodity contracts at El Segundo, Marsh Landing and Walnut Creek.
See Note 5, Fair Value of Financial Instruments, for a discussion regarding concentration of credit risk.
22
Note 7 — Long-term Debt
This note should be read in conjunction with the complete description under Item 15 — Note 10, Long-term Debt, to the consolidated financial statements included in the Company’s 2025 Form 10-K. The Company’s borrowings, including short-term and long-term portions, consisted of the following:
| Maturity Date | March 31, 2026 | December 31, 2025 | Interest Rate (a) | |||||||||||||||||||||||
| (In millions) | ||||||||||||||||||||||||||
| Intercompany Note with Clearway, Inc. | 2026 | $ | $ | % | ||||||||||||||||||||||
| Senior Notes | 2028-2034 | |||||||||||||||||||||||||
Clearway Energy LLC and Clearway Energy Operating LLC Revolving Credit Facility (b) | 2028 | S+ | ||||||||||||||||||||||||
| Non-recourse facility-level debt: | ||||||||||||||||||||||||||
| Fixed rate | 2031-2040 | |||||||||||||||||||||||||
| Variable rate | 2026-2036 | S+ | ||||||||||||||||||||||||
| Total debt | ||||||||||||||||||||||||||
| Less current maturities | ( | ( | ||||||||||||||||||||||||
| Less net debt issuance costs | ( | ( | ||||||||||||||||||||||||
Add premiums (c) | ||||||||||||||||||||||||||
| Total long-term debt | $ | $ | ||||||||||||||||||||||||
(a) As of March 31, 2026, S+ equals SOFR plus x%.
(b) Applicable rate is determined by the borrower leverage ratio, as defined in the credit agreement.
(c) Premiums relate to the 2028 Senior Notes and the debt assumed in the Cardinal Portfolio acquisition.
As of March 31, 2026, the Company had $1,256 million in letters of credit outstanding, $151 million of which is related to the Company’s revolving credit facility.
The financing arrangements listed above contain certain covenants, including financial covenants that the Company is required to be in compliance with during the term of the respective arrangement. As of March 31, 2026, the Company was in compliance with all of the required covenants.
The discussion below describes material changes to or additions of long-term debt for the three months ended March 31, 2026.
2034 Senior Notes
On January 13, 2026, Clearway Energy Operating LLC completed the sale of $600 million aggregate principal amount of senior unsecured notes due 2034, or the 2034 Senior Notes. The 2034 Senior Notes bear interest at a rate of 5.750 % per annum and mature on January 15, 2034. Interest on the 2034 Senior Notes is payable semi-annually on January 15 and July 15 of each year, beginning on July 15, 2026. The 2034 Senior Notes are unsecured obligations of Clearway Energy Operating LLC and are guaranteed by Clearway Energy LLC and by certain of Clearway Energy Operating LLC’s wholly-owned current and future subsidiaries. The net proceeds from the 2034 Senior Notes were used to repay $361 million in outstanding borrowings under the revolving credit facility and for general corporate purposes.
Facility-level Debt
Honeycomb Portfolio
On May 1, 2026, when the Honeycomb Portfolio BESS facilities reached substantial completion, the Company paid $81 million to Clearway Renew as additional purchase price in connection with the Company’s acquisition of Honeycomb TargetCo LLC, or Honeycomb TargetCo, from Clearway Renew on October 15, 2025, which was funded with existing sources of liquidity. The Company’s total capital investment in Honeycomb TargetCo was $97 million. Also, on May 1, 2026, the tax equity investor in Honeycomb TE Holdco LLC contributed an additional $254 million, which was utilized along with the $60 million previously held in escrow, to repay the $234 million tax equity bridge loan and to pay $14 million in associated fees with the remaining $67 million distributed to CEG. During 2026, the Company borrowed an additional $71 million in construction loans, and on May 1, 2026, the total outstanding construction loans were converted to a term loan in the amount of $327 million that matures on May 1, 2031.
23
Cardinal Portfolio
On February 5, 2026, the Company, through its indirect subsidiary, Cardinal Investment Holdco LLC, entered into a financing arrangement that provides for a term loan of up to $100 million and $119 million in letters of credit in support of debt service and facility-level obligations. On March 30, 2026, the Company borrowed $100 million to partially fund the acquisition of the Cardinal Portfolio, as further described in Note 3, Acquisitions. The financing is supported by the Company’s interest in the Cardinal Portfolio. The term loan bears interest at a rate of SOFR plus 2.00 % per annum and matures on March 29, 2027.
In connection with the acquisition of the Cardinal Portfolio on March 30, 2026, as further described in Note 3, Acquisitions, the Company assumed existing facility‑level debt associated with certain of the acquired facilities. The assumed debt is secured by the respective facilities and is non‑recourse to the Company. In accordance with ASC 805, the assumed debt was recorded at its estimated fair value as of the acquisition date. The assumed facility‑level debt has maturities ranging from 2032 through 2036.
Mesquite Sky Restructuring
On March 27, 2026, the Company restructured its existing energy‑related commodity contract associated with the Mesquite Sky wind facility, which resulted in an in‑substance financing to settle existing derivative liabilities over time. As a result of the restructuring, the Company derecognized derivative liabilities with a fair value of $115 million, as well as $12 million owed to the counterparty that was previously included in other non‑current liabilities, and recognized a term financing obligation with an initial carrying amount of $127 million. The financing obligation is repaid through fixed monthly payments beginning in May 2026 and matures on September 30, 2035. Total payments over the term of the arrangement are $162 million, which implies an effective interest rate of approximately 5.436 %. Interest expense is recognized over the term of the obligation using the effective interest method.
In connection with the restructuring, the Company also entered into a 15‑year PPA with an investment‑grade counterparty, which replaces the volumetric and price exposure of Mesquite Sky’s energy‑related commodity contract with more favorable pricing.
Goat Mountain Repowering
On February 27, 2026, the Company, through its indirect subsidiaries, Goat Mountain Class B Holdco LLC and Goat Wind LLC, as co-borrowers, entered into a financing arrangement for non-recourse debt for a total commitment of $703 million, which consists of a construction loan that converts to a five-year term loan upon the repowering of the facility reaching substantial completion, which is expected to occur in the second half of 2027, as well as bridge loans to be repaid with the proceeds from the tax equity investor. The construction loan and bridge loans bear interest at a rate of SOFR plus 1.50 % and mature on the term conversion date. The Company’s initial borrowing of $140 million was utilized to pay $88 million under the development services agreement, as further described in Note 10, Related Party Transactions, $15 million in debt issuance costs that were deferred and $5 million in capital expenditures. Under the financing arrangement, the Company borrowed $151 million through March 31, 2026.
Pine Forest
On January 15, 2026, the Company repaid the $231 million outstanding on the tax credit transfer bridge loan utilizing the proceeds received from the sale of transferable ITCs and distributed the remaining $51 million to CEG.
Note 8 — Members’ Equity
Class A Conversion
On April 29, 2026, at Clearway Inc.’s Annual Meeting of Stockholders, Clearway, Inc.’s stockholders approved the Amended Charter, pursuant to which each outstanding share of Clearway, Inc.’s Class A common stock was converted into one share of Clearway Inc.’s Class C common stock, effective May 1, 2026, referred to as the Class A Conversion. As a result of the Class A Conversion, Clearway, Inc. no longer has any Class A common stock.
In connection with the Class A Conversion, Clearway, Inc. and CEG entered into a Fifth Amended and Restated Limited Liability Company Agreement of the Company, pursuant to which, effective concurrently with the Class A Conversion, each outstanding Class A unit of the Company was converted into one Class C unit of the Company. As a result of such conversion, the Company no longer has any Class A Units.
24
The conversion of the Company’s Class A Units into Class C Units did not affect the economic interests of the Company’s unit holders, including distribution and liquidation rights. Following such conversion, holders of the Company’s former Class A units converted into Class C units remain entitled to receive distributions, if declared by the Company, on the same basis as prior to the conversion.
Direct Stock Purchase Plan, or DSPP
As previously disclosed in the Company’s Annual Report on Form 10‑K for the year ended December 31, 2025, Clearway, Inc. maintains a DSPP, pursuant to which it may issue shares of its Class C common stock, including through waiver arrangements.
During January 2026, Clearway, Inc. issued 1,445,244 shares of its Class C common stock under the DSPP for gross proceeds of $50 million and incurred fees of less than $1 million, which were exchanged for 1,445,244 of the Company’s Class C units. As of March 31, 2026, 1,061,554 shares of Clearway, Inc.’s Class C common stock remained available for issuance under the DSPP.
Distributions
The following table lists distributions paid on the Company’s Class A, B, C and D units during the three months ended March 31, 2026:
First Quarter 2026 | ||||||||
| Distributions per Class A, B, C and D unit | $ | |||||||
As a result of the Class A Conversion discussed above, the Company no longer has any Class A units outstanding, and holders of the Company’s former Class A units converted into Class C units remain entitled to receive distributions, if declared by the Company, on the same basis as prior to the conversion.
On May 6, 2026, the Company declared a distribution on its Class B, Class C, including Class C units that were received in the Class A Conversion, and Class D units of $0.4676
25
Note 9 — Segment Reporting
The Company’s segment structure reflects how management currently operates and allocates resources. The Company’s businesses are segregated based on Flexible Generation and Renewables & Storage businesses, which consist of solar, wind and battery energy storage system, or BESS, facilities. The Corporate segment reflects the Company’s corporate costs and includes eliminating entries. The Company’s chief operating decision maker, its Chief Executive Officer, evaluates the performance of its segments based on net income (loss). The Company’s Chief Executive Officer reviews net income (loss) and its components on a monthly and quarterly basis to evaluate the performance of each segment and to determine how to allocate resources.
| Three months ended March 31, 2026 | |||||||||||||||||||||||
| (In millions) | Flexible Generation | Renewables & Storage | Corporate (a) | Total | |||||||||||||||||||
| Operating revenues | $ | $ | $ | $ | |||||||||||||||||||
| Cost of operations, exclusive of depreciation, amortization and accretion shown separately below | |||||||||||||||||||||||
| Depreciation, amortization and accretion | |||||||||||||||||||||||
| General and administrative | |||||||||||||||||||||||
| Transaction and integration costs | |||||||||||||||||||||||
| Operating income (loss) | ( | ||||||||||||||||||||||
| Equity in earnings of unconsolidated affiliates | |||||||||||||||||||||||
| Other income, net | |||||||||||||||||||||||
| Loss on debt extinguishment | ( | ( | |||||||||||||||||||||
| Interest expense | ( | ( | ( | ( | |||||||||||||||||||
| Net Loss | ( | ( | ( | ( | |||||||||||||||||||
| Less: Net loss attributable to noncontrolling interests and redeemable noncontrolling interests | ( | ( | |||||||||||||||||||||
| Net (Loss) Income Attributable to Clearway Energy LLC | $ | ( | $ | $ | ( | $ | |||||||||||||||||
| Balance Sheet | |||||||||||||||||||||||
| Equity investments in affiliates | $ | $ | $ | $ | |||||||||||||||||||
Capital expenditures (b) | |||||||||||||||||||||||
| Total Assets | $ | $ | $ | $ | |||||||||||||||||||
(a) Includes eliminations.
(b) Includes accruals.
26
Three months ended March 31, 2025 (as revised) (a) | |||||||||||||||||||||||
| (In millions) | Flexible Generation | Renewables & Storage | Corporate (b) | Total | |||||||||||||||||||
| Operating revenues | $ | $ | $ | $ | |||||||||||||||||||
| Cost of operations, exclusive of depreciation, amortization and accretion shown separately below | |||||||||||||||||||||||
| Depreciation, amortization and accretion | |||||||||||||||||||||||
| General and administrative | |||||||||||||||||||||||
| Transaction and integration costs | |||||||||||||||||||||||
| Operating income (loss) | ( | ||||||||||||||||||||||
| Equity in earnings of unconsolidated affiliates | |||||||||||||||||||||||
| Other income, net | |||||||||||||||||||||||
| Interest expense | ( | ( | ( | ( | |||||||||||||||||||
| Net Income (Loss) | ( | ( | ( | ||||||||||||||||||||
| Less: Net loss attributable to noncontrolling interests | ( | ( | |||||||||||||||||||||
| Net Income (Loss) Attributable to Clearway Energy LLC | $ | $ | $ | ( | $ | ( | |||||||||||||||||
| Balance Sheet | |||||||||||||||||||||||
| Equity investments in affiliates | $ | $ | $ | $ | |||||||||||||||||||
Capital expenditures (c) | |||||||||||||||||||||||
| Total Assets | $ | $ | $ | $ | |||||||||||||||||||
(a) The following amounts were revised for the Renewables & Storage segment:
| Three months ended March 31, 2025 | |||||||||||||||||
| (In millions) | As Previously Reported | Adjustments | As Revised | ||||||||||||||
| Renewables & Storage Segment: | |||||||||||||||||
| Net loss attributable to noncontrolling interests | $ | ( | $ | $ | ( | ||||||||||||
| Net income attributable to Clearway Energy LLC | ( | ||||||||||||||||
(b) Includes eliminations.
(c) Includes accruals.
Note 10 — Related Party Transactions
In addition to the transactions and relationships described elsewhere in the notes to the consolidated financial statements, certain subsidiaries of CEG provide services to the Company and its operating subsidiaries. Amounts due to CEG subsidiaries are recorded as accounts payable — affiliates and amounts due to the Company from CEG subsidiaries are recorded as accounts receivable — affiliates in the Company’s consolidated balance sheets. The disclosures below summarize the Company’s material related party transactions with CEG and its subsidiaries that are included in the Company’s operating costs. This footnote should be read in conjunction with the complete description under Item 15 — Note 13, Related Party Transactions, to the consolidated financial statements included in the Company’s 2025 Form 10-K.
Goat Mountain Development Services Agreement with Clearway Renew
Pursuant to the development services agreement entered into in July 2025, in connection with the closing of the Goat Mountain construction financing on February 27, 2026, as further described in Note 7, Long-term Debt, the Company acquired assets totaling $106 million, consisting of $98 million for deposits related to the future delivery of equipment, which is included in other non-current assets on the Company’s consolidated balance sheet, and $8 million of capital expenditures. Of this amount, $70 million was paid to Clearway Renew on February 27, 2026, with the remaining $36 million outstanding as of March 31, 2026. Also on February 27, 2026, the Company paid Clearway Renew $18 million in fees under the development services agreement. The Company estimates that its total capital investment in the Goat Mountain repowering will be $200 million, subject to closing adjustments.
27
O&M Services Agreements by and between the Company and Clearway Renewable Operation & Maintenance LLC
Various subsidiaries of the Company in the Renewables & Storage segment are party to services agreements with Clearway Renewable Operation & Maintenance LLC, or RENOM, a wholly-owned subsidiary of CEG, which provides operation and maintenance, or O&M, services to these subsidiaries. The Company incurred total expenses for these services of $21 12 million and $8 million due to RENOM as of March 31, 2026 and December 31, 2025, respectively.
Administrative Services Agreements by and between the Company and CEG
Various subsidiaries of the Company are parties to services agreements with Clearway Asset Services LLC and Clearway Solar Asset Management LLC, two wholly-owned subsidiaries of CEG, which provide various administrative services to the Company's subsidiaries. The Company incurred expenses under these agreements of $6 million and $5 million for the three months ended March 31, 2026 and 2025, respectively. Expenses for these services are included in cost of operations in the consolidated statements of operations. There was a balance of $4 million and $3 million due to CEG as of March 31, 2026 and December 31, 2025, respectively.
CEG Master Services Agreement
The Company, along with certain of its subsidiaries, is a party to the CEG Master Services Agreement, pursuant to which CEG and certain of its affiliates or third-party service providers provide certain services to the Company. These services include operational and administrative services, such as human resources, information systems, cybersecurity, external affairs, legal, risk management, internal audit, accounting, procurement, tax and treasury services, in exchange for the payment of fees in respect of such services, which are settled on a quarterly basis. The Company also directly bears labor costs for certain CEG employees who perform work on behalf of the Company.
The Company incurred expenses under the CEG Master Services Agreement of $7 million and $6 million for the three months ended March 31, 2026 and 2025, respectively. Expenses for these services are included in general and administrative in the consolidated statements of operations.
Note 11 — Revision of Previously Issued Unaudited Financial Information
As discussed in Item 15 — Note 16, Revision of Previously Issued Unaudited Financial Information (Unaudited), during the fourth quarter of 2025, the Company’s management identified errors related to certain calculations of hypothetical liquidation at book value (HLBV) accounting used to allocate net income (loss) to the Company’s redeemable noncontrolling interests and noncontrolling interests in tax equity partnerships in each of the quarters ended March 31, 2025, June 30, 2025 and September 30, 2025. The Company evaluated the materiality of the errors in accordance with Staff Accounting Bulletins No. 99 and No. 108 of the SEC and concluded that the errors were immaterial to all previously reported periods and did not require restatement of any previously issued financial statements.
28
A summary of the corrections to the impacted financial statement line items is presented below:
| Three months ended March 31, 2025 | ||||||||||||||
| (in millions) | As Previously Reported | Adjustments | As Revised | |||||||||||
| (Unaudited) | ||||||||||||||
| Consolidated Statement of Operations | ||||||||||||||
| Net loss attributable to noncontrolling interests | $ | ( | $ | $ | ( | |||||||||
| Net income (loss) attributable to Clearway Energy LLC | $ | $ | ( | $ | ( | |||||||||
| Consolidated Statement of Comprehensive Income (Loss) | ||||||||||||||
| Comprehensive loss attributable to noncontrolling interests | $ | ( | $ | $ | ( | |||||||||
| Comprehensive income (loss) attributable to Clearway Energy LLC | $ | $ | ( | $ | ( | |||||||||
| Consolidated Balance Sheet (As of March 31, 2025) | ||||||||||||||
| Retained earnings | $ | $ | ( | $ | ||||||||||
| Noncontrolling interest | ||||||||||||||
| Total Members’ Equity | $ | $ | $ | |||||||||||
| Consolidated Statements of Members’ Equity | ||||||||||||||
| Retained Earnings: | ||||||||||||||
| Net income (loss) | $ | $ | ( | $ | ( | |||||||||
| Retained Earnings at March 31, 2025 | $ | $ | ( | $ | ||||||||||
| Noncontrolling Interest: | ||||||||||||||
| Net loss | $ | ( | $ | $ | ( | |||||||||
| Noncontrolling Interest at March 31, 2025 | $ | $ | $ | |||||||||||
See Note 9, Segment Reporting, for more details related to the revisions included in the notes to the financial statements.
29
ITEM 2 — Management’s Discussion and Analysis of Financial Condition and the Results of Operations
The following discussion analyzes the Company’s historical financial condition and results of operations.
As you read this discussion and analysis, refer to the Company’s consolidated financial statements to this Form 10-Q, which present the results of operations for the three months ended March 31, 2026 and 2025. Also refer to the Company’s 2025 Form 10-K, which includes detailed discussions of various items impacting the Company’s business, results of operations and financial condition.
The discussion and analysis below has been organized as follows:
•Executive Summary, including a description of the business and significant events that are important to understanding the results of operations and financial condition;
•Results of operations, including an explanation of significant differences between the periods in the specific line items of the consolidated statements of operations;
•Financial condition addressing liquidity position, sources and uses of cash, capital resources and requirements, commitments and off-balance sheet arrangements;
•Known trends that may affect the Company’s results of operations and financial condition in the future; and
•Critical accounting policies which are most important to both the portrayal of the Company’s financial condition and results of operations, and which require management’s most difficult, subjective or complex judgment.
30
Executive Summary
Introduction and Overview
Clearway Energy LLC, together with its consolidated subsidiaries, or the Company, is an energy infrastructure investor with a focus on investments in clean energy and owner of modern, sustainable and long-term contracted assets across North America. The Company is sponsored by Clearway Energy Group LLC, or CEG.
The Company is one of the largest owners of clean energy generation assets in the U.S. The Company’s portfolio comprises approximately 13.6 GW of gross capacity in 27 states, including approximately 10.8 GW of wind, solar and battery energy storage systems, or BESS, and approximately 2.8 GW of dispatchable combustion-based power generation assets included in the Flexible Generation segment that provide critical grid reliability services. Through this environmentally-sound, diversified and primarily contracted portfolio, the Company endeavors to provide its investors with stable and growing distributions. The majority of the Company’s revenues are derived from long-term contractual arrangements for the output or capacity from these assets. The weighted average remaining contract duration of the Company’s Renewables & Storage segment offtake agreements was approximately 12 years as of March 31, 2026 based on CAFD.
As of March 31, 2026, the Company’s operating assets are comprised of the following facilities:
| Capacity | ||||||||||||||||||||||||||||||||
| Percentage | Rated | Net | Contract | |||||||||||||||||||||||||||||
| Facilities | Ownership | MW | MW (a) | Counterparty | Expiration | |||||||||||||||||||||||||||
| Flexible Generation | ||||||||||||||||||||||||||||||||
| Carlsbad | 100 | % | 523 | 523 | SDG&E | 2038 | ||||||||||||||||||||||||||
| El Segundo | 100 | % | 546 | 546 | Various | 2027 - 2029 | ||||||||||||||||||||||||||
| GenConn Devon | 50 | % | 190 | 95 | Connecticut Light & Power | 2040 | ||||||||||||||||||||||||||
| GenConn Middletown | 50 | % | 190 | 95 | Connecticut Light & Power | 2041 | ||||||||||||||||||||||||||
| Marsh Landing | 100 | % | 820 | 820 | Various | 2026 - 2030 | ||||||||||||||||||||||||||
| Walnut Creek | 100 | % | 501 | 501 | Various | 2026 - 2027 | ||||||||||||||||||||||||||
| Total Flexible Generation | 2,770 | 2,580 | ||||||||||||||||||||||||||||||
| Utility Scale Solar | ||||||||||||||||||||||||||||||||
| Agua Caliente | 51 | % | 290 | 148 | PG&E | 2039 | ||||||||||||||||||||||||||
| Alpine | 100 | % | 66 | 66 | PG&E | 2033 | ||||||||||||||||||||||||||
Arica (b) | 40 | % | 263 | 105 | Various | 2036 - 2041 | ||||||||||||||||||||||||||
| Avenal | 50 | % | 45 | 23 | PG&E | 2031 | ||||||||||||||||||||||||||
Buckthorn Solar (b) | 100 | % | 150 | 150 | City of Georgetown, TX | 2043 | ||||||||||||||||||||||||||
Cardinal Portfolio JV (c) | 50 | % | 95 | 48 | Various | 2035 - 2041 | ||||||||||||||||||||||||||
| Catalina | —% (d) | 109 | 109 | SDG&E | 2038 | |||||||||||||||||||||||||||
Conetoe (c) | 100 | % | 80 | 80 | Corning Inc. and Lockheed Martin | 2040 | ||||||||||||||||||||||||||
| CVSR | 100 | % | 250 | 250 | PG&E | 2038 | ||||||||||||||||||||||||||
Daggett 2 (b) | 25 | % | 182 | 46 | Various | 2038 | ||||||||||||||||||||||||||
Daggett 3 (b) | 25 | % | 300 | 75 | Various | 2033 - 2038 | ||||||||||||||||||||||||||
| Desert Sunlight 250 | 25 | % | 250 | 63 | SCE | 2034 | ||||||||||||||||||||||||||
| Desert Sunlight 300 | 25 | % | 300 | 75 | PG&E | 2039 | ||||||||||||||||||||||||||
| Enterprise | 100 | % | 80 | 80 | PacifiCorp | 2036 | ||||||||||||||||||||||||||
| Escalante I | 100 | % | 80 | 80 | PacifiCorp | 2036 | ||||||||||||||||||||||||||
| Escalante II | 100 | % | 80 | 80 | PacifiCorp | 2036 | ||||||||||||||||||||||||||
| Escalante III | 100 | % | 80 | 80 | PacifiCorp | 2036 | ||||||||||||||||||||||||||
| Granite Mountain East | 100 | % | 80 | 80 | PacifiCorp | 2036 | ||||||||||||||||||||||||||
| Granite Mountain West | 100 | % | 50 | 50 | PacifiCorp | 2036 | ||||||||||||||||||||||||||
| Iron Springs | 100 | % | 80 | 80 | PacifiCorp | 2036 | ||||||||||||||||||||||||||
Luna Valley (b) | 100 | % | 200 | 200 | Various | 2040 - 2045 | ||||||||||||||||||||||||||
Mililani I (b) | 50 | % | 39 | 20 | Hawaiian Electric Company | 2042 | ||||||||||||||||||||||||||
Oahu Solar (b) | 100 | % | 61 | 61 | Hawaiian Electric Company | 2041 | ||||||||||||||||||||||||||
Pine Forest (b) | 50 | % | 300 | 150 | Various | 2040 - 2045 | ||||||||||||||||||||||||||
Rosamond Central (b) | 50 | % | 192 | 96 | Various | 2035 - 2047 | ||||||||||||||||||||||||||
31
| Capacity | ||||||||||||||||||||||||||||||||
| Percentage | Rated | Net | Contract | |||||||||||||||||||||||||||||
| Facilities | Ownership | MW | MW (a) | Counterparty | Expiration | |||||||||||||||||||||||||||
Rosamond South I (b) | 50 | % | 140 | 70 | Various | 2040 | ||||||||||||||||||||||||||
Shoreham (b) (c) | 100 | % | 25 | 25 | Long Island Power Authority | 2038 | ||||||||||||||||||||||||||
Texas Solar Nova 1 (b) | 50 | % | 252 | 126 | Verizon | 2042 | ||||||||||||||||||||||||||
Texas Solar Nova 2 (b) | 50 | % | 200 | 100 | Verizon | 2042 | ||||||||||||||||||||||||||
Victory Pass (b) | 40 | % | 200 | 80 | Various | 2039 | ||||||||||||||||||||||||||
Waiawa (b) | 50 | % | 36 | 18 | Hawaiian Electric Company | 2043 | ||||||||||||||||||||||||||
| Other Utility Scale Solar | 100 | % | 175 | 175 | Various | 2029 - 2038 | ||||||||||||||||||||||||||
| Total Utility Scale Solar | 4,730 | 2,889 | ||||||||||||||||||||||||||||||
| Utility Scale BESS | ||||||||||||||||||||||||||||||||
Arica (b) | 40 | % | 136 | 54 | Various | 2039 - 2041 | ||||||||||||||||||||||||||
Daggett 1 (b) | 100 | % | 114 | 114 | SDG&E | 2040 | ||||||||||||||||||||||||||
Daggett 2 (b) | 25 | % | 131 | 33 | Various | 2038 | ||||||||||||||||||||||||||
Daggett 3 (b) | 25 | % | 149 | 37 | Various | 2033 - 2038 | ||||||||||||||||||||||||||
Mililani I (b) | 50 | % | 39 | 20 | Hawaiian Electric Company | 2042 | ||||||||||||||||||||||||||
Pine Forest (b) | 50 | % | 200 | 100 | N/A | |||||||||||||||||||||||||||
Rosamond Central (b) | 50 | % | 147 | 74 | SCE | 2039 | ||||||||||||||||||||||||||
Rosamond South I (b) | 50 | % | 117 | 59 | Various | 2035 - 2040 | ||||||||||||||||||||||||||
Victory Pass (b) | 40 | % | 50 | 20 | Various | 2039 | ||||||||||||||||||||||||||
Waiawa (b) | 50 | % | 36 | 18 | Hawaiian Electric Company | 2043 | ||||||||||||||||||||||||||
| Total Utility Scale BESS | 1,119 | 529 | ||||||||||||||||||||||||||||||
| Distributed Solar | ||||||||||||||||||||||||||||||||
Cardinal Portfolio (c) | 100 | % | 239 | 239 | Various | 2027 - 2040 | ||||||||||||||||||||||||||
Cardinal Portfolio JV (c) | 50 | % | 130 | 65 | Various | 2033 - 2041 | ||||||||||||||||||||||||||
DGPV Funds (b) | 100 | % | 286 | 286 | Various | 2030 - 2044 | ||||||||||||||||||||||||||
| Solar Power Partners (SPP) | 100 | % | 24 | 24 | Various | 2026 - 2037 | ||||||||||||||||||||||||||
| Other DG Facilities | 100 | % | 20 | 20 | Various | 2026 - 2039 | ||||||||||||||||||||||||||
| Total Distributed Solar | 699 | 634 | ||||||||||||||||||||||||||||||
| Utility Scale Wind | ||||||||||||||||||||||||||||||||
| Alta I - V | 100 | % | 720 | 720 | SCE | 2035 | ||||||||||||||||||||||||||
| Alta X - XI | 100 | % | 227 | 227 | SCE | 2038 | ||||||||||||||||||||||||||
Black Rock (b) | 50 | % | 115 | 58 | Toyota and Google | 2036 | ||||||||||||||||||||||||||
| Broken Bow | 100 | % | 80 | 80 | Nebraska Public Power District | 2032 | ||||||||||||||||||||||||||
Cedar Creek (b) | 100 | % | 160 | 160 | PacifiCorp | 2049 | ||||||||||||||||||||||||||
Cedro Hill (b) | 100 | % | 160 | 160 | CPS Energy | 2045 | ||||||||||||||||||||||||||
| Crofton Bluffs | 100 | % | 42 | 42 | Nebraska Public Power District | 2032 | ||||||||||||||||||||||||||
Dan’s Mountain (b) | 50 | % | 55 | 28 | Constellation Energy Generation | 2037 | ||||||||||||||||||||||||||
Elbow Creek (b) | 100 | % | 122 | 122 | Various | 2029 | ||||||||||||||||||||||||||
| Elkhorn Ridge | 66.7 | % | 81 | 54 | Nebraska Public Power District | 2029 | ||||||||||||||||||||||||||
Goat Mountain (e) | 99 | % | 150 | 149 | N/A | |||||||||||||||||||||||||||
Langford (b) | 100 | % | 160 | 160 | Goldman Sachs | 2033 | ||||||||||||||||||||||||||
| Laredo Ridge | 100 | % | 81 | 81 | Nebraska Public Power District | 2031 | ||||||||||||||||||||||||||
Mesquite Sky (b) | 50 | % | 340 | 170 | Various | 2041 | ||||||||||||||||||||||||||
Mesquite Star (b) | 50 | % | 419 | 210 | Various | 2032 - 2035 | ||||||||||||||||||||||||||
| Mountain Wind 1 | 100 | % | 61 | 61 | PacifiCorp | 2033 | ||||||||||||||||||||||||||
| Mountain Wind 2 | 100 | % | 80 | 80 | PacifiCorp | 2033 | ||||||||||||||||||||||||||
| Ocotillo | 100 | % | 55 | 55 | N/A | |||||||||||||||||||||||||||
32
| Capacity | ||||||||||||||||||||||||||||||||
| Percentage | Rated | Net | Contract | |||||||||||||||||||||||||||||
| Facilities | Ownership | MW | MW (a) | Counterparty | Expiration | |||||||||||||||||||||||||||
Pinnacle (b) | 100 | % | 54 | 54 | Maryland Department of General Services and University System of Maryland | 2031 | ||||||||||||||||||||||||||
Rattlesnake (b) (f) | 100 | % | 160 | 160 | Avista Corporation | 2040 | ||||||||||||||||||||||||||
| San Juan Mesa | 75 | % | 120 | 90 | Southwestern Public Service Company | 2026 | ||||||||||||||||||||||||||
| Sleeping Bear | 100 | % | 95 | 95 | Public Service Company of Oklahoma | 2032 | ||||||||||||||||||||||||||
| South Trent | 100 | % | 101 | 101 | AEP Energy Partners | 2029 | ||||||||||||||||||||||||||
| Spring Canyon II and III | 100 | % | 63 | 63 | Platte River Power Authority | 2039 | ||||||||||||||||||||||||||
| Taloga | 100 | % | 130 | 130 | Oklahoma Gas & Electric | 2031 | ||||||||||||||||||||||||||
| Tuolumne | 100 | % | 137 | 137 | Turlock Irrigation District | 2040 | ||||||||||||||||||||||||||
Wildorado (b) | 100 | % | 161 | 161 | Southwestern Public Service Company | 2030 | ||||||||||||||||||||||||||
| Other Utility Scale Wind | 100 | % | 105 | 105 | Various | 2027 - 2033 | ||||||||||||||||||||||||||
| Total Wind | 4,234 | 3,713 | ||||||||||||||||||||||||||||||
| Total Clearway Energy LLC | 13,552 | 10,345 | ||||||||||||||||||||||||||||||
(a) For owned facilities, net capacity represents the maximum, or rated, generating or storage capacity of the facility multiplied by the Company’s percentage ownership in the facility as of March 31, 2026.
(b) Facilities are part of tax equity arrangements, as further described in Note 4, Investments Accounted for by the Equity Method and Variable Interest Entities.
(c) Facilities are part of the Cardinal Portfolio acquisition, which closed on March 30, 2026, as further described in Note 3, Acquisitions.
(d) The Company leases 100% of the interests in the Catalina solar facility through a facility lease agreement that expires in October 2043.
(e) The Goat Mountain wind facility commenced repowering activities in February 2026 and was taken offline. Repowering commercial operations is expected to occur in the second half of 2027.
(f) Rattlesnake has a deliverable capacity of 144 MW.
33
Significant Events
Third-Party Acquisitions
•On March 30, 2026, the Company, through its indirect subsidiaries, Cardinal Purchaser LLC and Cardinal JV Purchaser LLC, completed the acquisition of the Cardinal Portfolio for total cash consideration of $324 million, subject to post-closing adjustments. Of the total consideration, $244 million was paid by Cardinal Purchaser LLC related to facilities consolidated by the Company and $80 million was paid by Cardinal JV Purchaser LLC related to facilities held through a joint venture with a third-party investor, recorded as an equity method investment. After factoring in cash acquired, transaction expenses and proceeds from the related financing activities, the Company estimates that its net capital investment in the Cardinal Portfolio will be approximately $240 million. See Note 3, Acquisitions, for further discussion of the transaction.
Financing Activities
•On May 1, 2026, when the Honeycomb Portfolio BESS facilities reached substantial completion, the Company paid $81 million to Clearway Renew as additional purchase price in connection with the Company’s acquisition of Honeycomb TargetCo from Clearway Renew on October 15, 2025. The Company’s total capital investment in Honeycomb TargetCo was $97 million. Also, on May 1, 2026, the tax equity investor in Honeycomb TE Holdco LLC contributed an additional $254 million, which was utilized along with the $60 million previously held in escrow, to repay the tax equity bridge loan and to pay associated fees with the remaining proceeds distributed to CEG. See Note 7, Long-term Debt, for further discussion of the transaction.
•On March 30, 2026, the Company, through its indirect subsidiary, Cardinal Investment Holdco LLC, borrowed $100 million under a new financing arrangement that was entered into in February 2026 to partially fund the acquisition of the Cardinal Portfolio. In connection with the acquisition, the Company also assumed non-recourse facility-level debt associated with certain of the acquired facilities. See Note 7, Long-term Debt, for further discussion of the financing arrangement and assumed non-recourse facility-level debt.
•On March 27, 2026, the Company restructured its existing energy‑related commodity contract associated with the Mesquite Sky wind facility, which resulted in an in-substance financing to settle derivative liabilities over time. The term financing obligation has an initial carrying amount of $127 million and total payments over the term of the arrangement are $162 million. In connection with the restructuring, the Company also entered into a 15‑year PPA with an investment‑grade counterparty. See Note 7, Long-term Debt, for further discussion of the Mesquite Sky restructuring.
•On February 27, 2026, the Company, through its indirect subsidiaries, Goat Mountain Class B Holdco LLC and Goat Wind LLC, as co-borrowers, entered into a financing arrangement for non-recourse debt for a total commitment of $703 million. The Company made initial borrowings under the arrangement to fund costs associated with the Goat Mountain repowering, including payments under the development services agreement with Clearway Renew. See Note 7, Long-term Debt, and Note 10, Related Party Transactions, for further discussion.
•On January 15, 2026, the Company repaid the $231 million outstanding on the Pine Forest tax credit transfer bridge loan utilizing the proceeds received from the sale of transferable ITCs and distributed the remaining $51 million to CEG, as further described in Note 7, Long-term Debt.
•On January 13, 2026, Clearway Energy Operating LLC completed the sale of $600 million aggregate principal amount of 5.75% senior unsecured notes due 2034, or the 2034 Senior Notes. See Note 7, Long-term Debt, for further discussion of the 2034 Senior Notes.
Environmental Matters
The Company is subject to a wide range of environmental laws during the development, construction, ownership and operation of facilities. These existing and future laws generally require that governmental permits and approvals be obtained before construction and maintained during operation of facilities. The Company is obligated to comply with all environmental laws and regulations applicable within each jurisdiction and required to implement environmental programs and procedures to monitor and control risks associated with the construction, operation and decommissioning of regulated or permitted energy assets. Federal, state and local environmental laws have historically become more stringent over time, although this trend has recently shifted at the federal level.
The Company’s environmental matters are further described in the Company’s 2025 Form 10-K in Item 1, Business — Environmental Matters and Item 1A, Risk Factors.
34
Regulatory Matters
The Company’s regulatory matters are described in Item 1, Business — Regulatory Matters and Item 1A, Risk Factors, of the Company’s 2025 Form 10-K.
35
Consolidated Results of Operations
The following table provides selected financial information:
| Three months ended March 31, | ||||||||||||||||||||
| (In millions) | 2026 | 2025 | Change | |||||||||||||||||
| Operating Revenues | ||||||||||||||||||||
| Energy and capacity revenues | $ | 358 | $ | 333 | $ | 25 | ||||||||||||||
| Other revenues | 16 | 20 | (4) | |||||||||||||||||
| Contract amortization | (50) | (44) | (6) | |||||||||||||||||
| Mark-to-market for economic hedges | 30 | (11) | 41 | |||||||||||||||||
| Total operating revenues | 354 | 298 | 56 | |||||||||||||||||
| Operating Costs and Expenses | ||||||||||||||||||||
| Cost of fuels | 1 | 2 | (1) | |||||||||||||||||
| Operations and maintenance | 106 | 93 | 13 | |||||||||||||||||
| Other costs of operations | 27 | 27 | — | |||||||||||||||||
| Depreciation, amortization and accretion | 181 | 163 | 18 | |||||||||||||||||
| General and administrative | 11 | 10 | 1 | |||||||||||||||||
| Transaction and integration costs | 7 | 3 | 4 | |||||||||||||||||
| Total operating costs and expenses | 333 | 298 | 35 | |||||||||||||||||
| Operating Income | 21 | — | 21 | |||||||||||||||||
| Other Income (Expense) | ||||||||||||||||||||
| Equity in earnings of unconsolidated affiliates | 5 | 5 | — | |||||||||||||||||
| Other income, net | 8 | 7 | 1 | |||||||||||||||||
| Loss on debt extinguishment | (2) | — | (2) | |||||||||||||||||
| Derivative interest expense | — | (34) | 34 | |||||||||||||||||
| Other interest expense | (101) | (82) | (19) | |||||||||||||||||
| Total other expense, net | (90) | (104) | 14 | |||||||||||||||||
| Net Loss | (69) | (104) | 35 | |||||||||||||||||
| Less: Net loss attributable to noncontrolling interests and redeemable noncontrolling interests | (184) | (99) | (85) | |||||||||||||||||
| Net Income (Loss) Attributable to Clearway Energy LLC | $ | 115 | $ | (5) | $ | 120 | ||||||||||||||
| Three months ended March 31, | ||||||||||||||
| Business metrics: | 2026 | 2025 | ||||||||||||
Solar MWh generated/sold (in thousands) (a) | 2,118 | 1,738 | ||||||||||||
Wind MWh generated/sold (in thousands) (a) | 2,709 | 2,743 | ||||||||||||
Solar & Wind MWh generated/sold (in thousands) (a) | 4,827 | 4,481 | ||||||||||||
Solar weighted-average capacity factor (b) | 25.1 | % | 25.7 | % | ||||||||||
Wind weighted-average capacity factor (c) | 31.5 | % | 33.9 | % | ||||||||||
| Flexible Generation MWh generated (in thousands) | 34 | 65 | ||||||||||||
| Flexible Generation equivalent availability factor | 88.7 | % | 89.3 | % | ||||||||||
(a) Volumes do not include the MWh generated/sold by the Company’s equity method investments.
(b) Typical average capacity factors for solar facilities is 25%. The weighted-average capacity factors can vary based on seasonality and weather.
(c) Typical average capacity factors for wind facilities is 25-45%. The weighted-average capacity factors can vary based on seasonality and weather.
36
Management’s Discussion of the Results of Operations for the Three Months Ended March 31, 2026 and 2025
Operating Revenues
Operating revenues increased by $56 million during the three months ended March 31, 2026, compared to the same period in 2025, due to a combination of the drivers summarized in the table below:
| (In millions) | ||||||||
| Renewables & Storage Segment | Increase primarily driven by the Daggett 1 BESS, Luna Valley solar, Pine Forest solar and BESS and Rosamond South I solar and BESS acquisitions, which reached commercial operations in the second half of 2025, as well as the Catalina solar acquisition in the second half of 2025. | $ | 32 | |||||
| Increase driven by the Tuolumne wind acquisition in April 2025, as well as the Dan’s Mountain wind acquisition, which reached commercial operations in May 2025. | 13 | |||||||
| Decrease primarily driven by lower wind resource at the Alta facilities. | (18) | |||||||
| Decrease driven by the Mt. Storm wind sale to Clearway Renew in October 2025 in connection with the repowering. | (8) | |||||||
| Flexible Generation Segment | Increase reflects normal operating variability. | 2 | ||||||
| Contract amortization | Decrease primarily driven by additional amortization from the Tuolumne wind and Catalina solar acquisitions, in April 2025 and July 2025, respectively. | (6) | ||||||
| Mark-to-market economic hedging activities | Increase primarily driven by a decrease in forward power prices in the ERCOT market. | 57 | ||||||
| Decrease in value of heat rate call option contracts primarily driven by changes in power market prices. | (9) | |||||||
| Decrease driven by the Mt. Storm hedge buy-out, which occurred during the second and third quarters of 2025. | (7) | |||||||
| $ | 56 | |||||||
Depreciation, Amortization and Accretion
Depreciation, amortization and accretion increased by $18 million during the three months ended March 31, 2026, compared to the same period in 2025, primarily due to the solar and BESS acquisitions referenced above.
Interest Expense
Interest expense decreased by $15 million during the three months ended March 31, 2026, compared to the same period in 2025, primarily due to the following:
| (In millions) | |||||
| Change in fair value of interest rate swaps due to changes in interest rates | $ | (34) | |||
| Increase in interest expense for the Renewables & Storage segment primarily due to an increase in principal balances from the solar and BESS acquisitions referenced above | 11 | ||||
| Increase in interest expense for the Corporate segment primarily due to the issuance of the 2034 Senior Notes | 8 | ||||
| $ | (15) | ||||
37
Net Loss Attributable to Noncontrolling Interests and Redeemable Noncontrolling Interests
For the three months ended March 31, 2026, the Company had a net loss of $184 million attributable to noncontrolling interests and redeemable noncontrolling interests comprised of the following:
| (In millions) | |||||
Losses attributable to tax equity financing arrangements and the application of the HLBV method (primarily due to Daggett 1 TE Holdco LLC, Luna Valley TE Holdco LLC and Pine Forest TE HoldCo LLC HLBV losses) | $ | (296) | |||
| Income attributable to third-party partnerships (primarily from the equity pickup of Pine Forest TE HoldCo LLC HLBV losses) | 112 | ||||
| $ | (184) | ||||
For the three months ended March 31, 2025, the Company had a net loss of $99 million attributable to noncontrolling interests comprised of the following:
| (In millions) | |||||
| Losses attributable to tax equity financing arrangements and the application of the HLBV method (primarily due VP-Arica TE Holdco LLC and Cedro Hill TE Holdco LLC HLBV losses) | $ | (98) | |||
| Losses attributable to third-party partnerships | (1) | ||||
| $ | (99) | ||||
38
Liquidity and Capital Resources
The Company’s principal liquidity requirements are to meet its financial commitments, finance current operations, fund capital expenditures, including investments and acquisitions from time to time, service debt and pay distributions. As a normal part of the Company’s business, depending on market conditions, the Company will from time to time consider opportunities to repay, redeem, repurchase or refinance its indebtedness. Changes in the Company’s operating plans, lower than anticipated sales, increased expenses, investments, acquisitions or other events may cause the Company to seek additional debt or equity financing in future periods. There can be no guarantee that financing will be available on acceptable terms or at all. Debt financing, if available, could impose additional cash payment obligations and additional covenants and operating restrictions.
Current Liquidity Position
As of March 31, 2026 and December 31, 2025, the Company’s liquidity was approximately $1,229 million and $1,061 million, respectively, comprised of cash, restricted cash and availability under the Company’s revolving credit facility.
| (In millions) | March 31, 2026 | December 31, 2025 | ||||||||||||
| Cash and cash equivalents: | ||||||||||||||
| Clearway Energy LLC, excluding subsidiaries | $ | 92 | $ | 37 | ||||||||||
| Subsidiaries | 233 | 194 | ||||||||||||
| Restricted cash: | ||||||||||||||
| Operating accounts | 141 | 146 | ||||||||||||
| Reserves, including debt service, distributions, performance obligations and other reserves | 214 | 441 | ||||||||||||
| Total cash, cash equivalents and restricted cash | 680 | 818 | ||||||||||||
| Revolving credit facility availability | 549 | 243 | ||||||||||||
| Total liquidity | $ | 1,229 | $ | 1,061 | ||||||||||
The Company’s liquidity includes $355 million and $587 million of restricted cash balances as of March 31, 2026 and December 31, 2025, respectively. Restricted cash consists primarily of funds to satisfy the requirements of certain debt arrangements and funds held within the Company’s facilities that are restricted in their use. As of March 31, 2026, these restricted funds were comprised of $141 million designated to fund operating expenses, approximately $97 million designated for current debt service payments and $85 million restricted for reserves including debt service, performance obligations and other reserves, as well as capital expenditures. The remaining $32 million is held in distribution reserve accounts. In January 2026, the Company distributed $174 million to the tax equity investor in Rosie South TE Holdco LLC related to transferable ITCs for the Rosamond South I solar and BESS facility that were included in restricted cash as of December 31, 2025.
Clearway Energy LLC and Clearway Energy Operating LLC Revolving Credit Facility
As of March 31, 2026, the Company had no outstanding borrowings under the revolving credit facility and $151 million in letters of credit outstanding. During January 2026, the Company repaid all of the outstanding borrowings under the revolving credit facility utilizing the proceeds from the sale of the 2034 Senior Notes. The facility will continue to be used for general corporate purposes including financing of future investments or acquisitions and posting letters of credit.
Management believes that the Company’s liquidity position, cash flows from operations and availability under its revolving credit facility will be adequate to meet the Company’s financial commitments; debt service obligations; growth, operating and maintenance capital expenditures; and to fund distributions to Clearway, Inc. and CEG. Management continues to regularly monitor the Company’s ability to finance the needs of its operating, financing and investing activities within the dictates of prudent balance sheet management.
Credit Ratings
Credit rating agencies rate a firm’s public debt securities. These ratings are utilized by the debt markets in evaluating a firm’s credit risk. Ratings influence the price paid to issue new debt securities by indicating to the market the Company’s ability to pay principal, interest and preferred dividends. Rating agencies evaluate a firm’s industry, cash flow, leverage, liquidity and hedge profile, among other factors, in their credit analysis of a firm’s credit risk. As of March 31, 2026, the Company’s 2028 Senior Notes, 2031 Senior Notes, 2032 Senior Notes and 2034 Senior Notes were rated BB by S&P and Ba2 by Moody’s.
39
Sources of Liquidity
The Company’s principal sources of liquidity include cash on hand, cash generated from operations, proceeds from sales of assets, borrowings under new and existing financing arrangements and the issuance of additional equity and debt securities by Clearway, Inc. or the Company as appropriate given market conditions. As described in Note 7, Long-term Debt, and Note 8, Members’ Equity, to this Form 10-Q and Item 15 — Note 10, Long-term Debt, and Note 11, Members’ Equity, to the consolidated financial statements included in the Company’s 2025 Form 10-K, and further below, the Company’s financing arrangements consist of corporate-level debt, which includes Senior Notes, intercompany borrowings with Clearway, Inc. and the revolving credit facility; facility-level financings for its various assets; the ATM Program and the DSPP.
Goat Mountain Repowering Financing — On February 27, 2026, the Company, through its indirect subsidiaries, Goat Mountain Class B Holdco LLC and Goat Wind LLC, as co-borrowers, entered into a financing arrangement for non-recourse debt for a total commitment of $703 million, which consists of a construction loan that converts to a five-year term loan upon substantial completion of the repowering, as well as bridge loans to be repaid with the proceeds from the tax equity investor. The construction loan and bridge loans bear interest at a rate of SOFR plus 1.50% and mature on the term conversion date. The initial borrowing of $140 million was primarily used to fund costs associated with the Goat Mountain repowering, including payments under the development services agreement, deferred debt issuance costs and capital expenditures. Under the financing arrangement, the Company borrowed $151 million through March 31, 2026. The Company estimates that its total capital investment in the Goat Mountain repowering will be $200 million, subject to closing adjustments.
2034 Senior Notes — On January 13, 2026, Clearway Energy Operating LLC completed the sale of $600 million aggregate principal amount of senior unsecured notes due 2034, or the 2034 Senior Notes. The 2034 Senior Notes bear interest at a rate of 5.750% per annum and mature on January 15, 2034. Interest on the 2034 Senior Notes is payable semi-annually on January 15 and July 15 of each year, beginning on July 15, 2026. The net proceeds from the 2034 Senior Notes were used to repay $361 million in outstanding borrowings under the revolving credit facility and for general corporate purposes.
Direct Stock Purchase Plan, or DSPP — In January 2026, Clearway, Inc. issued 1,445,244 shares of Class C common stock under the DSPP for gross proceeds of $50 million and incurred fees of less than $1 million, which were exchanged for 1,445,244 of the Company’s Class C units. As of March 31, 2026, 1,061,554 shares of Clearway, Inc.’s Class C common stock remained available for issuance under the DSPP.
Uses of Liquidity
The Company’s requirements for liquidity and capital resources, other than for operating its facilities, are categorized as: (i) debt service obligations, as described more fully in Note 7, Long-term Debt; (ii) capital expenditures; (iii) off-balance sheet arrangements; (iv) acquisitions and investments, as described more fully in Note 3, Acquisitions, Note 7, Long-term Debt, and Note 8, Members’ Equity; and (v) distributions.
Capital Expenditures
The Company’s capital spending program is mainly focused on maintenance capital expenditures, consisting of costs to maintain the assets currently operating, such as costs to replace or refurbish assets during routine maintenance, and growth capital expenditures consisting of costs to construct new assets, costs to increase the operating capacity of existing assets and costs to complete the construction of assets where construction is in process.
For the three months ended March 31, 2026, the Company used approximately $75 million to fund capital expenditures, including growth expenditures of $70 million, primarily in the Renewables & Storage segment, funded through construction-related financing. Growth capital expenditures included $29 million incurred in connection with the Honeycomb Portfolio BESS facilities, $22 million incurred in connection with the Pine Forest solar and BESS facility, $17 million incurred in connection with the repowering of the Goat Mountain wind facility and $2 million incurred by other facilities. In addition, the Company incurred $5 million of maintenance capital expenditures.
Off-Balance Sheet Arrangements
Obligations under Certain Guarantee Contracts
The Company may enter into guarantee arrangements in the normal course of business to facilitate commercial transactions with third parties.
Retained or Contingent Interests
The Company does not have any material retained or contingent interests in assets transferred to an unconsolidated entity.
40
Obligations Arising Out of a Variable Interest in an Unconsolidated Entity
Variable interest in equity investments — As of March 31, 2026, the Company has several investments with an ownership interest percentage of 50% or less. GenConn is a VIE for which the Company is not the primary beneficiary. The Company’s pro-rata share of non-recourse debt held by unconsolidated affiliates was approximately $367 million as of March 31, 2026. This indebtedness may restrict the ability of these subsidiaries to issue dividends or distributions to the Company.
Contractual Obligations and Commercial Commitments
The Company has a variety of contractual obligations and other commercial commitments that represent prospective cash requirements in addition to the Company’s capital expenditure programs, as disclosed in the Company’s 2025 Form 10-K.
Acquisitions and Investments
The Company intends to acquire generation assets developed and constructed by CEG, as well as generation assets from third parties where the Company believes its knowledge of the market and operating expertise provides a competitive advantage, and to utilize such acquisitions as a means to grow its business.
Honeycomb Portfolio Drop Down — On May 1, 2026, when the Honeycomb Portfolio BESS facilities reached substantial completion, the Company paid $81 million to Clearway Renew as additional purchase price in connection with the Company’s acquisition of Honeycomb TargetCo from Clearway Renew on October 15, 2025, which was funded with existing sources of liquidity. The Company’s total capital investment in Honeycomb TargetCo was $97 million. Also, on May 1, 2026, the tax equity investor in Honeycomb TE Holdco LLC contributed an additional $254 million, which was utilized along with the $60 million previously held in escrow, to repay the tax equity bridge loan and to pay associated fees with the remaining proceeds distributed to CEG. During 2026, the Company borrowed an additional $71 million in construction loans, and on May 1, 2026, the total outstanding construction loans were converted to a term loan.
Cardinal Portfolio Acquisition — On March 30, 2026, the Company, through its indirect subsidiaries, Cardinal Purchaser LLC and Cardinal JV Purchaser LLC, completed the acquisition of the Cardinal Portfolio for total cash consideration of $324 million, subject to post-closing adjustments. Of the total consideration, $244 million was paid by Cardinal Purchaser LLC related to facilities consolidated by the Company and $80 million was paid by Cardinal JV Purchaser LLC related to facilities held through a joint venture with a third-party investor. The Cardinal Portfolio has a weighted average remaining contract duration of approximately 10 years. The acquisition was funded with $100 million in borrowings under the new financing arrangement entered into in connection with the acquisition, as well as existing sources of liquidity. In connection with the acquisition, the Company also assumed non-recourse facility-level debt associated with certain of the acquired facilities. After factoring in cash acquired, transaction expenses and proceeds from the related financing activities, the Company estimates that its net capital investment in the Cardinal Portfolio will be approximately $240 million.
Mesquite Sky Restructuring — On March 27, 2026, the Company restructured its existing energy‑related commodity contract associated with the Mesquite Sky wind facility, which resulted in an in‑substance financing to settle existing derivative liabilities over time. As a result of the restructuring, the Company derecognized derivative liabilities with a fair value of $115 million, as well as $12 million owed to the counterparty that was previously included in other non‑current liabilities, and recognized a term financing obligation with an initial carrying amount of $127 million. The financing obligation is repaid through fixed monthly payments beginning in May 2026 and matures on September 30, 2035. Total payments over the term of the arrangement are $162 million, which implies an effective interest rate of approximately 5.436%. In connection with the restructuring, the Company also entered into a 15‑year PPA with an investment‑grade counterparty, which replaces the volumetric and price exposure of Mesquite Sky’s energy‑related commodity contract with more favorable pricing.
Pine Forest — On January 15, 2026, the Company repaid the $231 million outstanding on the tax credit transfer bridge loan utilizing the proceeds received from the sale of transferable ITCs and distributed the remaining $51 million to CEG, as further described in Note 7, Long-term Debt.
Cash Distributions to Clearway, Inc. and CEG
The Company intends to distribute to its unit holders in the form of a quarterly distribution all of the CAFD it generates each quarter, less reserves for the prudent conduct of the business, including among others, maintenance capital expenditures to maintain the operating capacity of the Company’s assets. Distributions on the Company’s units are subject to available capital, market conditions and compliance with associated laws, regulations and other contractual obligations. The Company expects that, based on current circumstances, comparable cash distributions will continue to be paid in the foreseeable future.
41
The following table lists the distributions paid on the Company’s Class A, B, C and D units during the three months ended March 31, 2026:
First Quarter 2026 | ||||||||
| Distributions per Class A, B, C and D unit | $ | 0.4602 | ||||||
As a result of the Class A Conversion discussed in Note 8, Members’ Equity, the Company no longer has any Class A units outstanding, and holders of the Company’s former Class A units converted into Class C units remain entitled to receive distributions, if declared by the Company, on the same basis as prior to the conversion.
On May 6, 2026, the Company declared a distribution on its Class B, Class C, including Class C units that were received in the Class A Conversion, and Class D units of $0.4676 per unit payable on June 15, 2026 to unit holders of record as of June 1, 2026.
42
Cash Flow Discussion
The following tables reflect the changes in cash flows for the comparative periods:
| Three months ended March 31, | |||||||||||||||||
| 2026 | 2025 | Change | |||||||||||||||
| (In millions) | |||||||||||||||||
| Net cash provided by operating activities | $ | 120 | $ | 90 | $ | 30 | |||||||||||
| Net cash used in investing activities | (441) | (46) | (395) | ||||||||||||||
| Net cash provided by (used in) financing activities | 183 | (71) | 254 | ||||||||||||||
Net Cash Provided by Operating Activities
| Changes to net cash provided by operating activities were driven by: | (In millions) | ||||
| Increase from changes in working capital primarily driven by the timing of accounts receivable collections and payments of current liabilities, including accounts payable and accrued liabilities | $ | 42 | |||
| Increase in distributions from unconsolidated affiliates | 1 | ||||
| Decrease in operating income after adjusting for non-cash items | (13) | ||||
| $ | 30 | ||||
Net Cash Used in Investing Activities
| Changes to net cash used in investing activities were driven by: | (In millions) | ||||
| Cash paid for third party acquisitions, net of cash acquired, in 2026 related to the Cardinal Portfolio | $ | (228) | |||
| Investments in unconsolidated affiliates in 2026 related to the Cardinal Portfolio JV | (76) | ||||
| Payments for equipment deposits and asset purchases from affiliate in 2026 related to the Goat Mountain repowering | (70) | ||||
| Increase in capital expenditures | (19) | ||||
| Decrease in cash paid for Drop Down Assets, net of cash acquired | 4 | ||||
| Other | (6) | ||||
| $ | (395) | ||||
Net Cash Provided by (Used in) Financing Activities
| Changes in net cash provided by (used in) financing activities were driven by: | (In millions) | ||||
| Payments for the revolving credit facility in 2026 | $ | (361) | |||
| Payments of debt issuance costs in 2026 | (25) | ||||
| Increase in distributions to noncontrolling interests, Clearway, Inc. and CEG, net of contributions | (10) | ||||
| Increase in distributions paid to unit holders | (8) | ||||
| Increase in proceeds from issuance of long-term debt and payments for long-term debt | 611 | ||||
| Proceeds from the exchange of Class C units in connection with issuances under the DSPP in 2026 | 50 | ||||
| Other | (3) | ||||
| $ | 254 | ||||
43
Fair Value of Derivative Instruments
The Company may enter into energy-related commodity contracts to mitigate variability in earnings due to fluctuations in spot market prices. In addition, in order to mitigate interest rate risk associated with the issuance of variable rate debt, the Company enters into interest rate swap agreements.
The tables below disclose the activities of non-exchange traded contracts accounted for at fair value in accordance with ASC 820. Specifically, these tables disaggregate realized and unrealized changes in fair value; disaggregate estimated fair values at March 31, 2026, based on their level within the fair value hierarchy defined in ASC 820; and indicate the maturities of contracts at March 31, 2026. For a full discussion of the Company’s valuation methodology of its contracts, see Derivative Fair Value Measurements in Note 5, Fair Value of Financial Instruments.
| Derivative Activity (Losses) Gains | (In millions) | ||||
| Fair value of contracts as of December 31, 2025 | $ | (204) | |||
| Contracts realized, restructured or otherwise settled during the period | 116 | ||||
| Contracts added during the period | 6 | ||||
| Changes in fair value | 41 | ||||
| Fair value of contracts as of March 31, 2026 | $ | (41) | |||
| Fair value of contracts as of March 31, 2026 | |||||||||||||||||||||||||||||
| Maturity | |||||||||||||||||||||||||||||
| Fair Value Hierarchy (Losses) Gains | 1 Year or Less | Greater Than 1 Year to 3 Years | Greater Than 3 Years to 5 Years | Greater Than 5 Years | Total Fair Value | ||||||||||||||||||||||||
| (In millions) | |||||||||||||||||||||||||||||
| Level 2 | $ | 24 | $ | 72 | $ | 21 | $ | 17 | $ | 134 | |||||||||||||||||||
| Level 3 | (26) | (66) | (50) | (33) | (175) | ||||||||||||||||||||||||
| Total | $ | (2) | $ | 6 | $ | (29) | $ | (16) | $ | (41) | |||||||||||||||||||
The Company has elected to disclose derivative assets and liabilities on a trade-by-trade basis and does not offset amounts at the counterparty master agreement level.
Critical Accounting Policies and Estimates
The Company’s discussion and analysis of the financial condition and results of operations are based upon the consolidated financial statements, which have been prepared in accordance with GAAP. The preparation of these financial statements and related disclosures in compliance with GAAP requires the application of appropriate technical accounting rules and guidance, as well as the use of estimates and judgments that affect the reported amounts of assets, liabilities, revenues and expenses, and related disclosures of contingent assets and liabilities. The application of these policies necessarily involves judgments regarding future events, including the likelihood of success of particular facilities, legal and regulatory challenges and the fair value of certain assets and liabilities. These judgments, in and of themselves, could materially affect the financial statements and disclosures based on varying assumptions, which may be appropriate to use. In addition, the financial and operating environment may also have a significant effect, not only on the operation of the business, but on the results reported through the application of accounting measures used in preparing the financial statements and related disclosures, even if the nature of the accounting policies has not changed.
On an ongoing basis, the Company evaluates these estimates, utilizing historic experience, consultation with experts and other methods the Company considers reasonable. Actual results may differ substantially from the Company’s estimates. Any effects on the Company’s business, financial position or results of operations resulting from revisions to these estimates are recorded in the period in which the information that gives rise to the revision becomes known.
The Company identifies its most critical accounting policies as those that are the most pervasive and important to the portrayal of the Company’s financial position and results of operations, and that require the most difficult, subjective and/or complex judgments by management regarding estimates about matters that are inherently uncertain. The Company’s critical accounting policies include accounting utilizing HLBV and determining the fair value of financial instruments.
44
Recent Accounting Developments
See Note 2, Summary of Significant Accounting Policies, for a discussion of recent accounting developments.
45
ITEM 3 — Quantitative and Qualitative Disclosures About Market Risk
The Company is exposed to several market risks in its normal business activities. Market risk is the potential loss that may result from market changes associated with the Company’s power generation or with an existing or forecasted financial or commodity transaction. The types of market risks the Company is exposed to are commodity price risk, interest rate risk, liquidity risk and credit risk. The following disclosures about market risk provide an update to, and should be read in conjunction with, Item 7A — Quantitative and Qualitative Disclosures About Market Risk, of the Company’s 2025 Form 10-K.
Commodity Price Risk
Commodity price risks result from exposures to changes in spot prices, forward prices, volatilities and correlations between various commodities, such as electricity, natural gas and emissions credits. The Company manages the commodity price risk of certain of its merchant generation operations by entering into derivative or non-derivative instruments to hedge the variability in future cash flows from forecasted power sales. The portion of forecasted transactions hedged may vary based upon management's assessment of market, weather, operation and other factors.
Based on a sensitivity analysis using simplified assumptions, the impact of a $0.50 per MWh increase or decrease in power prices across the term of the long-term power commodity contracts would cause a change of approximately $3 million to the net value of the related derivatives as of March 31, 2026.
Interest Rate Risk
The Company is exposed to fluctuations in interest rates through its issuance of variable rate debt. Exposures to interest rate fluctuations may be mitigated by entering into derivative instruments known as interest rate swaps, caps, collars and put or call options. These contracts reduce exposure to interest rate volatility and result in primarily fixed rate debt obligations when taking into account the combination of the variable rate debt and the interest rate derivative instrument. See Note 6, Derivative Instruments and Hedging Activities, for more information.
The Company and most of its subsidiaries enter into interest rate swaps intended to hedge the risks associated with interest rates on non-recourse facility-level debt or any potential refinancing of the Senior Notes. See Item 15 — Note 10, Long-term Debt, to the Company’s audited consolidated financial statements for the year ended December 31, 2025 included in the 2025 Form 10-K for more information about interest rate swaps of the Company’s subsidiaries.
If all of the interest rate swaps had been discontinued on March 31, 2026, the counterparties would have owed the Company $129 million. Based on the credit ratings of the counterparties, the Company believes its exposure to credit risk due to nonperformance by counterparties to its hedge contracts to be insignificant.
The Company has long-term debt instruments that subject it to the risk of loss associated with movements in market interest rates. As of March 31, 2026, a change of 1%, or 100 basis points, in interest rates would result in an approximately $3 million change in market interest expense on a rolling twelve-month basis.
As of March 31, 2026, the fair value of the Company’s debt was $8,877 million and the carrying value was $9,210 million. The Company estimates that a decrease of 1%, or 100 basis points, in market interest rates would have increased the fair value of its long-term debt by approximately $94 million.
Liquidity Risk
Liquidity risk arises from the general funding needs of the Company’s activities and in the management of the Company’s assets and liabilities.
Counterparty Credit Risk
Credit risk relates to the risk of loss resulting from non-performance or non-payment by counterparties pursuant to the terms of their contractual obligations. The Company monitors and manages credit risk through credit policies that include: (i) an established credit approval process; and (ii) the use of credit mitigation measures such as prepayment arrangements or volumetric limits. Risks surrounding counterparty performance and credit could ultimately impact the amount and timing of expected cash flows. The Company seeks to mitigate counterparty risk by having a diversified portfolio of counterparties. See Note 5, Fair Value of Financial Instruments, to the consolidated financial statements for more information about concentration of credit risk.
46
ITEM 4 — Controls and Procedures
Evaluation of Disclosure Controls and Procedures
Under the supervision and with the participation of the Company’s management, including its principal executive officer, principal financial officer and principal accounting officer, the Company conducted an evaluation of the effectiveness of the design and operation of its disclosure controls and procedures, as such term is defined in Rules 13a-15(e) or 15d-15(e) of the Exchange Act. Based on this evaluation, the Company’s principal executive officer, principal financial officer and principal accounting officer concluded that the Company’s disclosure controls and procedures were effective as of the end of the period covered by this Quarterly Report on Form 10-Q.
Remediation of Previously Reported Material Weakness
As previously disclosed in the Company’s 2025 Form 10‑K, the Company’s management identified a material weakness in its internal control over financial reporting related to ineffective controls over the review of certain calculations of HLBV accounting used to allocate net income (loss) to the Company’s redeemable noncontrolling interests and noncontrolling interests in tax equity partnerships. For further discussion, see Item 9A – Controls and Procedures, of the Company’s 2025 Form 10-K.
During the fourth quarter of 2025, the Company implemented and operated enhanced controls over the review of HLBV calculations designed to remediate this material weakness, and the Company again operated these controls during the first quarter of 2026. Based on management’s evaluation, including the operation and testing of these controls, the Company’s management concluded that the material weakness was remediated as of March 31, 2026.
Changes in Internal Control over Financial Reporting
During the first quarter of 2026, there were changes in internal control over financial reporting, specifically, modifications to certain existing internal controls and implementation of new controls and procedures as a result of CEG’s successful implementation of a new enterprise resource planning, or ERP, application to support its core business processes and data. The Company will continue to evaluate its internal control processes, including the operating effectiveness of impacted internal controls.
Other than the matter described above, there were no changes in the Company’s internal control over financial reporting (as such term is defined in Rule 13a-15(f) under the Exchange Act) during the quarter ended March 31, 2026 that materially affected, or are reasonably likely to materially affect, the Company’s internal control over financial reporting.
47
PART II — OTHER INFORMATION
ITEM 1 — LEGAL PROCEEDINGS
None.
ITEM 1A — RISK FACTORS
Information regarding risk factors appears in Part I, Item 1A, Risk Factors, in the Company’s 2025 Form 10-K. There have been no material changes in the Company’s risk factors since those reported in its 2025 Form 10-K.
ITEM 2 — UNREGISTERED SALES OF EQUITY SECURITIES AND USE OF PROCEEDS
None.
ITEM 3 — DEFAULTS UPON SENIOR SECURITIES
None.
ITEM 4 — MINE SAFETY DISCLOSURES
Not applicable.
ITEM 5 — OTHER INFORMATION
Insider Trading Plans
During the three months ended March 31, 2026, no director or officer (as defined in Rule 16a-1(f) of the Exchange Act) of the Company adopted, modified terminated
48
ITEM 6 — EXHIBITS
| Number | Description | Method of Filing | ||||||||||||
| 3.1 | Incorporated herein by reference to Exhibit 3.1 to the Company’s Current Report on Form 8-K filed on May 1, 2026. | |||||||||||||
| 4.1 | Incorporated herein by reference to Exhibit 4.1 to the Company’s Current Report on Form 8-K filed on January 13, 2026. | |||||||||||||
| 4.2 | Incorporated herein by reference to Exhibit 4.2 to the Company’s Current Report on Form 8-K filed on January 13, 2026. | |||||||||||||
| 10.1 | Incorporated herein by reference to Exhibit 10.1 to the Company’s Current Report on Form 8-K filed on April 2, 2026. | |||||||||||||
| 31.1 | Filed herewith. | |||||||||||||
| 31.2 | Filed herewith. | |||||||||||||
| 32 | Furnished herewith. | |||||||||||||
| 101 INS | Inline XBRL Instance Document. | Filed herewith. | ||||||||||||
| 101 SCH | Inline XBRL Taxonomy Extension Schema. | Filed herewith. | ||||||||||||
| 101 CAL | Inline XBRL Taxonomy Extension Calculation Linkbase. | Filed herewith. | ||||||||||||
| 101 DEF | Inline XBRL Taxonomy Extension Definition Linkbase. | Filed herewith. | ||||||||||||
| 101 LAB | Inline XBRL Taxonomy Extension Label Linkbase. | Filed herewith. | ||||||||||||
| 101 PRE | Inline XBRL Taxonomy Extension Presentation Linkbase. | Filed herewith. | ||||||||||||
| 104 | Cover Page Interactive Data File (the cover page interactive data file does not appear in Exhibit 104 because its Inline XBRL tags are embedded within the Inline XBRL document). | Filed herewith. | ||||||||||||
49
SIGNATURES
Pursuant to the requirements of Section 13 or 15(d) of the Securities Exchange Act of 1934, the registrant has duly caused this report to be signed on its behalf by the undersigned thereunto duly authorized.
| CLEARWAY ENERGY LLC (Registrant) | ||||||||||||||
| /s/ CRAIG CORNELIUS | ||||||||||||||
| Craig Cornelius | ||||||||||||||
President and Chief Executive Officer (Principal Executive Officer) | ||||||||||||||
| /s/ SARAH RUBENSTEIN | ||||||||||||||
| Sarah Rubenstein | ||||||||||||||
| Date: May 7, 2026 | Executive Vice President and Chief Financial Officer (Principal Financial Officer and Principal Accounting Officer) | |||||||||||||
50
EXHIBIT 31.1
CERTIFICATION
I, Craig Cornelius, certify that:
1.I have reviewed this quarterly report on Form 10-Q of Clearway Energy LLC;
2.Based on my knowledge, this report does not contain any untrue statement of a material fact or omit to state a material fact necessary to make the statements made, in light of the circumstances under which such statements were made, not misleading with respect to the period covered by this report;
3.Based on my knowledge, the financial statements, and other financial information included in this report, fairly present in all material respects the financial condition, results of operations and cash flows of the registrant as of, and for, the periods presented in this report;
4.The registrant's other certifying officers and I are responsible for establishing and maintaining disclosure controls and procedures (as defined in Exchange Act Rules 13a-15(e) and 15d-15(e)) and internal control over financial reporting (as defined in Exchange Act Rules 13a-15(f) and 15d-15(f)) for the registrant and have:
a.Designed such disclosure controls and procedures, or caused such disclosure controls and procedures to be designed under our supervision, to ensure that material information relating to the registrant, including its consolidated subsidiaries, is made known to us by others within those entities, particularly during the period in which this report is being prepared;
b.Designed such internal control over financial reporting, or caused such internal control over financial reporting to be designed under our supervision, to provide reasonable assurance regarding the reliability of financial reporting and the preparation of financial statements for external purposes in accordance with generally accepted accounting principles;
c.Evaluated the effectiveness of the registrant's disclosure controls and procedures and presented in this report our conclusions about the effectiveness of the disclosure controls and procedures, as of the end of the period covered by this report based on such evaluation; and
d.Disclosed in this report any change in the registrant's internal control over financial reporting that occurred during the registrant's most recent fiscal quarter (the registrant's fourth fiscal quarter in the case of an annual report) that has materially affected, or is reasonably likely to materially affect, the registrant's internal control over financial reporting; and
5.The registrant's other certifying officers and I have disclosed, based on our most recent evaluation of internal control over financial reporting, to the registrant's auditors and the audit committee of the registrant's board of directors (or persons performing the equivalent functions):
a.All significant deficiencies and material weaknesses in the design or operation of internal control over financial reporting which are reasonably likely to adversely affect the registrant's ability to record, process, summarize and report financial information; and
b.Any fraud, whether or not material, that involves management or other employees who have a significant role in the registrant's internal control over financial reporting.
| /s/ CRAIG CORNELIUS | |||||
Craig Cornelius President and Chief Executive Officer (Principal Executive Officer) | |||||
Date: May 7, 2026
EXHIBIT 31.2
CERTIFICATION
I, Sarah Rubenstein, certify that:
1.I have reviewed this quarterly report on Form 10-Q of Clearway Energy LLC;
2.Based on my knowledge, this report does not contain any untrue statement of a material fact or omit to state a material fact necessary to make the statements made, in light of the circumstances under which such statements were made, not misleading with respect to the period covered by this report;
3.Based on my knowledge, the financial statements, and other financial information included in this report, fairly present in all material respects the financial condition, results of operations and cash flows of the registrant as of, and for, the periods presented in this report;
4.The registrant's other certifying officers and I are responsible for establishing and maintaining disclosure controls and procedures (as defined in Exchange Act Rules 13a-15(e) and 15d-15(e)) and internal control over financial reporting (as defined in Exchange Act Rules 13a-15(f) and 15d-15(f)) for the registrant and have:
a.Designed such disclosure controls and procedures, or caused such disclosure controls and procedures to be designed under our supervision, to ensure that material information relating to the registrant, including its consolidated subsidiaries, is made known to us by others within those entities, particularly during the period in which this report is being prepared;
b.Designed such internal control over financial reporting, or caused such internal control over financial reporting to be designed under our supervision, to provide reasonable assurance regarding the reliability of financial reporting and the preparation of financial statements for external purposes in accordance with generally accepted accounting principles;
c.Evaluated the effectiveness of the registrant's disclosure controls and procedures and presented in this report our conclusions about the effectiveness of the disclosure controls and procedures, as of the end of the period covered by this report based on such evaluation; and
d.Disclosed in this report any change in the registrant's internal control over financial reporting that occurred during the registrant's most recent fiscal quarter (the registrant's fourth fiscal quarter in the case of an annual report) that has materially affected, or is reasonably likely to materially affect, the registrant's internal control over financial reporting; and
5.The registrant's other certifying officers and I have disclosed, based on our most recent evaluation of internal control over financial reporting, to the registrant's auditors and the audit committee of the registrant's board of directors (or persons performing the equivalent functions):
a.All significant deficiencies and material weaknesses in the design or operation of internal control over financial reporting which are reasonably likely to adversely affect the registrant's ability to record, process, summarize and report financial information; and
b.Any fraud, whether or not material, that involves management or other employees who have a significant role in the registrant's internal control over financial reporting.
| /s/ SARAH RUBENSTEIN | |||||
Sarah Rubenstein Executive Vice President and Chief Financial Officer (Principal Financial Officer and Principal Accounting Officer) | |||||
Date: May 7, 2026
EXHIBIT 32
CERTIFICATION PURSUANT TO
18 U.S.C. SECTION 1350,
AS ADOPTED PURSUANT TO
SECTION 906 OF THE SARBANES-OXLEY ACT OF 2002
In connection with the Quarterly Report of Clearway Energy LLC on Form 10-Q for the quarter ended March 31, 2026, as filed with the Securities and Exchange Commission on the date hereof (the “Form 10-Q”), each of the undersigned officers of the Company certifies, pursuant to 18 U.S.C. Section 1350, as adopted pursuant to Section 906 of the Sarbanes-Oxley Act of 2002, that, to such officer's knowledge:
(1)The Form 10-Q fully complies with the requirements of Section 13(a) or 15(d) of the Securities Exchange Act of 1934; and
(2)The information contained in the Form 10-Q fairly presents, in all material respects, the financial condition and results of operations of the Company as of the dates and for the periods expressed in the Form 10-Q.
Date: May 7, 2026
| /s/ CRAIG CORNELIUS | ||||||||||||||
| Craig Cornelius | ||||||||||||||
President and Chief Executive Officer (Principal Executive Officer) | ||||||||||||||
| /s/ SARAH RUBENSTEIN | ||||||||||||||
| Sarah Rubenstein | ||||||||||||||
Executive Vice President and Chief Financial Officer (Principal Financial Officer and Principal Accounting Officer) | ||||||||||||||
The foregoing certification is being furnished solely pursuant to 18 U.S.C. Section 1350 and is not being filed as part of this Form 10-Q or as a separate disclosure document.
A signed original of this written statement required by Section 906, or other document authenticating, acknowledging or otherwise adopting the signature that appears in typed form within the electronic version of this written statement required by Section 906, has been provided to Clearway Energy LLC and will be retained by Clearway Energy LLC and furnished to the Securities and Exchange Commission or its staff upon request.